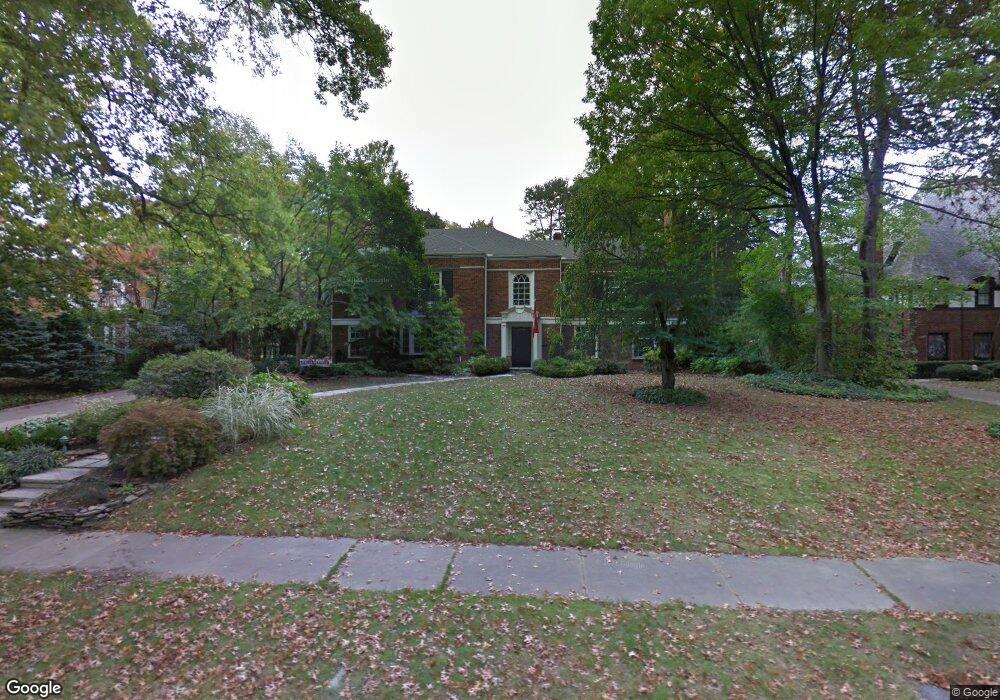
2947 Courtland Blvd Shaker Heights, OH 44122
Estimated Value: $701,000 - $921,576
4
Beds
6
Baths
4,195
Sq Ft
$193/Sq Ft
Est. Value
About This Home
This home is located at 2947 Courtland Blvd, Shaker Heights, OH 44122 and is currently estimated at $808,144, approximately $192 per square foot. 2947 Courtland Blvd is a home located in Cuyahoga County with nearby schools including Onaway Elementary School, Woodbury Elementary School, and Shaker Heights Middle School.
Ownership History
Date
Name
Owned For
Owner Type
Purchase Details
Closed on
Jan 26, 2005
Sold by
Lyren Philip and Lyren Greta
Bought by
Schinabeck Matthew and Schinabeck Anne
Current Estimated Value
Home Financials for this Owner
Home Financials are based on the most recent Mortgage that was taken out on this home.
Original Mortgage
$524,000
Outstanding Balance
$266,691
Interest Rate
5.77%
Mortgage Type
Purchase Money Mortgage
Estimated Equity
$541,453
Purchase Details
Closed on
Jun 11, 2003
Sold by
Barber John C and Barber Margaret M
Bought by
Lyren Phillip and Lyren Greta
Home Financials for this Owner
Home Financials are based on the most recent Mortgage that was taken out on this home.
Original Mortgage
$322,700
Interest Rate
5.78%
Mortgage Type
Purchase Money Mortgage
Purchase Details
Closed on
Jun 11, 1999
Sold by
Minister Public Bldg & Works United King
Bought by
Barber John C and Barber Margaret M
Purchase Details
Closed on
Jan 1, 1975
Bought by
United Kingdoms
Create a Home Valuation Report for This Property
The Home Valuation Report is an in-depth analysis detailing your home's value as well as a comparison with similar homes in the area
Home Values in the Area
Average Home Value in this Area
Purchase History
| Date | Buyer | Sale Price | Title Company |
|---|---|---|---|
| Schinabeck Matthew | $655,000 | Land Title Agency | |
| Lyren Phillip | $630,000 | Signature Title | |
| Barber John C | $590,000 | Midland Title Security Inc | |
| United Kingdoms | -- | -- |
Source: Public Records
Mortgage History
| Date | Status | Borrower | Loan Amount |
|---|---|---|---|
| Open | Schinabeck Matthew | $524,000 | |
| Closed | Lyren Phillip | $322,700 | |
| Closed | Schinabeck Matthew | $65,500 |
Source: Public Records
Tax History Compared to Growth
Tax History
| Year | Tax Paid | Tax Assessment Tax Assessment Total Assessment is a certain percentage of the fair market value that is determined by local assessors to be the total taxable value of land and additions on the property. | Land | Improvement |
|---|---|---|---|---|
| 2024 | $24,216 | $272,265 | $38,465 | $233,800 |
| 2023 | $23,829 | $212,110 | $36,230 | $175,880 |
| 2022 | $23,115 | $212,100 | $36,225 | $175,875 |
| 2021 | $23,036 | $212,100 | $36,230 | $175,880 |
| 2020 | $24,016 | $207,940 | $35,530 | $172,410 |
| 2019 | $23,669 | $594,100 | $101,500 | $492,600 |
| 2018 | $23,893 | $207,940 | $35,530 | $172,410 |
| 2017 | $25,020 | $207,970 | $29,120 | $178,850 |
| 2016 | $24,014 | $207,970 | $29,120 | $178,850 |
| 2015 | $23,503 | $207,970 | $29,120 | $178,850 |
| 2014 | $23,503 | $196,220 | $27,480 | $168,740 |
Source: Public Records
Map
Nearby Homes
- 19200 S Woodland Rd
- 3133 Somerset Dr
- 2945 Fontenay Rd
- 18100 S Woodland Rd
- 3180 Somerset Dr
- 3279 Warrensville Center Rd Unit 3 A
- 3279 Warrensville Center Rd Unit 15D
- 2980 Fontenay Rd
- 20962 Sydenham Rd
- 19101 Van Aken Blvd Unit 219
- 19201 Van Aken Blvd Unit 211
- 19201 Van Aken Blvd Unit 114
- 19201 Van Aken Blvd Unit 510
- 19201 Van Aken Blvd Unit 513
- 19015 Van Aken Blvd Unit 516
- 19901 Van Aken Blvd Unit C-106
- 19901 Van Aken Blvd Unit 205C
- 19901 Van Aken Blvd Unit 7
- 18975 Van Aken Blvd Unit 401
- 18975 Van Aken Blvd Unit 407
- 2963 Courtland Blvd
- 2931 Courtland Blvd
- 2940 Kingsley Rd
- 2960 Kingsley Rd
- 2977 Courtland Blvd
- 2915 Courtland Blvd
- 2928 Kingsley Rd
- 2974 Kingsley Rd
- 2918 Kingsley Rd
- 2948 Courtland Blvd
- 2986 Kingsley Rd
- 2995 Courtland Blvd
- 2899 Courtland Blvd
- 2964 Courtland Blvd
- 2932 Courtland Blvd
- 2906 Kingsley Rd
- 2978 Courtland Blvd
- 2916 Courtland Blvd
- 2996 Kingsley Rd
- 2951 Kingsley Rd