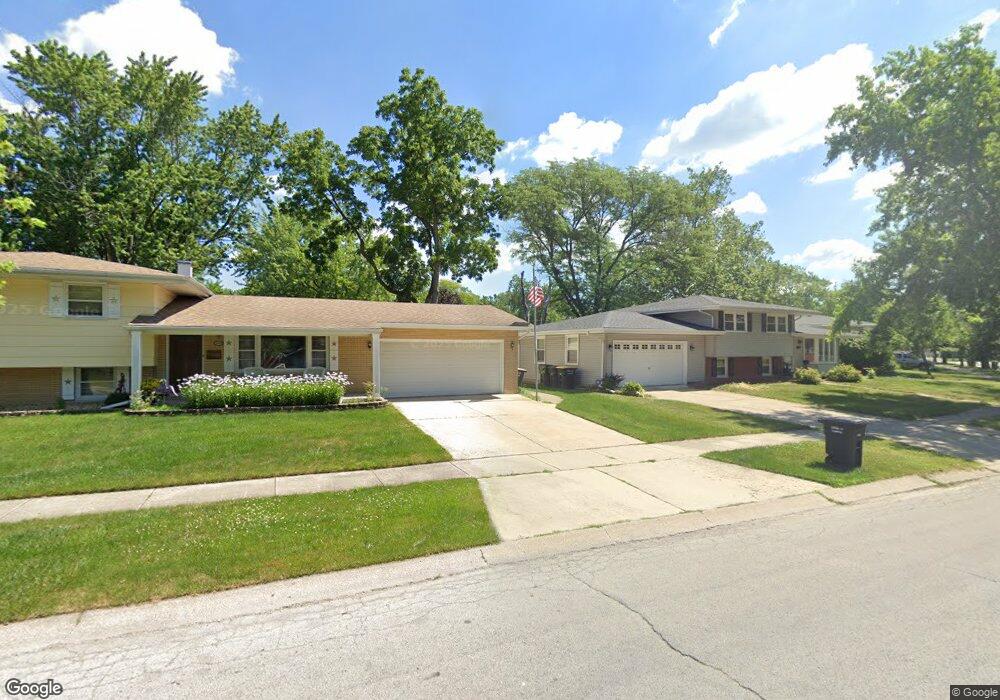
2948 188th Place Lansing, IL 60438
Estimated Value: $232,000 - $290,000
5
Beds
2
Baths
1,956
Sq Ft
$136/Sq Ft
Est. Value
About This Home
This home is located at 2948 188th Place, Lansing, IL 60438 and is currently estimated at $266,030, approximately $136 per square foot. 2948 188th Place is a home located in Cook County with nearby schools including Nathan Hale Elementary School, Heritage Middle School, and Thornton Fractnl So High School.
Ownership History
Date
Name
Owned For
Owner Type
Purchase Details
Closed on
May 16, 2017
Sold by
Melia Ronald and Melia Regina
Bought by
Bender Shirley A
Current Estimated Value
Home Financials for this Owner
Home Financials are based on the most recent Mortgage that was taken out on this home.
Original Mortgage
$151,844
Outstanding Balance
$126,208
Interest Rate
4.08%
Mortgage Type
New Conventional
Estimated Equity
$139,822
Purchase Details
Closed on
Feb 23, 2008
Sold by
Melia Ronald
Bought by
Melia Ronald and Keltner Regina
Home Financials for this Owner
Home Financials are based on the most recent Mortgage that was taken out on this home.
Original Mortgage
$150,000
Interest Rate
5.51%
Mortgage Type
New Conventional
Purchase Details
Closed on
Feb 14, 2003
Sold by
South Holland Trust & Savings Bank
Bought by
Melia Ronald
Home Financials for this Owner
Home Financials are based on the most recent Mortgage that was taken out on this home.
Original Mortgage
$118,750
Interest Rate
5.86%
Create a Home Valuation Report for This Property
The Home Valuation Report is an in-depth analysis detailing your home's value as well as a comparison with similar homes in the area
Home Values in the Area
Average Home Value in this Area
Purchase History
| Date | Buyer | Sale Price | Title Company |
|---|---|---|---|
| Bender Shirley A | $147,000 | Chicago Title | |
| Melia Ronald | -- | Ticor Title Ins Co 2002 | |
| Melia Ronald | $125,000 | Cti | |
| Melia Ronald | $125,000 | Cti |
Source: Public Records
Mortgage History
| Date | Status | Borrower | Loan Amount |
|---|---|---|---|
| Open | Bender Shirley A | $151,844 | |
| Previous Owner | Melia Ronald | $150,000 | |
| Previous Owner | Melia Ronald | $118,750 |
Source: Public Records
Tax History Compared to Growth
Tax History
| Year | Tax Paid | Tax Assessment Tax Assessment Total Assessment is a certain percentage of the fair market value that is determined by local assessors to be the total taxable value of land and additions on the property. | Land | Improvement |
|---|---|---|---|---|
| 2024 | $8,071 | $22,237 | $7,738 | $14,499 |
| 2023 | $5,747 | $22,237 | $7,738 | $14,499 |
| 2022 | $5,747 | $13,210 | $6,828 | $6,382 |
| 2021 | $5,591 | $13,210 | $6,828 | $6,382 |
| 2020 | $5,353 | $13,210 | $6,828 | $6,382 |
| 2019 | $5,874 | $14,791 | $6,372 | $8,419 |
| 2018 | $5,710 | $14,791 | $6,372 | $8,419 |
| 2017 | $5,620 | $14,791 | $6,372 | $8,419 |
| 2016 | $6,050 | $15,120 | $5,917 | $9,203 |
| 2015 | $5,806 | $15,120 | $5,917 | $9,203 |
| 2014 | $5,695 | $15,120 | $5,917 | $9,203 |
| 2013 | $5,675 | $16,414 | $5,917 | $10,497 |
Source: Public Records
Map
Nearby Homes
- 2950 188th Place
- 18905 Park Ave
- 18828 Greenbay Ave
- 3034 190th St
- 18602 Chicago Ave
- 18864 Greenbay Ave
- 18964 Wildwood Ave
- 3109 190th St Unit 2
- 2934 186th St
- 18855 Burnham Ave Unit 234
- 18855 Burnham Ave Unit 132
- 18855 Burnham Ave Unit 231
- 2958 191st St
- 3240 N Manor Dr Unit 130
- 3225 Otto St
- 18514 Ridgewood Ave
- 2838 191st Place
- 2849 191st Place
- 18452 Oakwood Ave
- 2924 192nd Place
- 18816 Park Ave
- 2956 188th Place
- 3006 188th St
- 2946 188th Place
- 18822 Park Ave
- 2944 188th Place
- 2938 188th Place
- 3004 188th Place
- 2932 188th Place
- 3014 188th St Unit 3
- 3020 188th St
- 18845 Ridgewood Ave
- 18823 Park Ave
- 2918 188th Place
- 18831 Chicago Ave
- 3005 188th Place
- 18850 Ridgewood Ave
- 2941 188th Place
- 3026 188th St Unit 3
- 18833 Park Ave