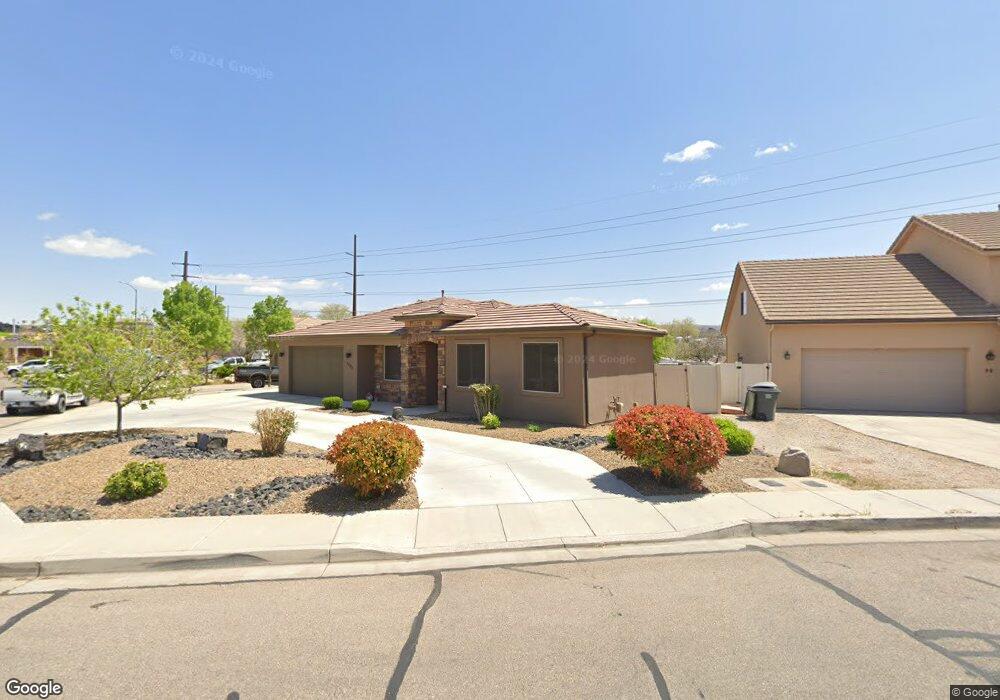
2948 E 110 Cir N St. George, UT 84790
Estimated Value: $454,315 - $480,000
3
Beds
2
Baths
1,722
Sq Ft
$271/Sq Ft
Est. Value
About This Home
This home is located at 2948 E 110 Cir N, St. George, UT 84790 and is currently estimated at $466,579, approximately $270 per square foot. 2948 E 110 Cir N is a home located in Washington County with nearby schools including Panorama School, Pine View Middle School, and Fossil Ridge Intermediate School.
Ownership History
Date
Name
Owned For
Owner Type
Purchase Details
Closed on
Apr 25, 2019
Sold by
Clark Samuel R and Clark Patricia L
Bought by
Clark Samuel R and Clark Patricia L
Current Estimated Value
Purchase Details
Closed on
Nov 14, 2017
Sold by
Kirk Tracon
Bought by
Clark Samuel R and Clark Patricia L
Home Financials for this Owner
Home Financials are based on the most recent Mortgage that was taken out on this home.
Original Mortgage
$119,500
Outstanding Balance
$100,135
Interest Rate
3.85%
Mortgage Type
New Conventional
Estimated Equity
$366,444
Purchase Details
Closed on
Dec 5, 2012
Sold by
Traveller Dennis K
Bought by
Kirk Tracon
Home Financials for this Owner
Home Financials are based on the most recent Mortgage that was taken out on this home.
Original Mortgage
$173,597
Interest Rate
3.25%
Mortgage Type
FHA
Create a Home Valuation Report for This Property
The Home Valuation Report is an in-depth analysis detailing your home's value as well as a comparison with similar homes in the area
Home Values in the Area
Average Home Value in this Area
Purchase History
| Date | Buyer | Sale Price | Title Company |
|---|---|---|---|
| Clark Samuel R | -- | None Available | |
| Clark Samuel R | -- | Synergy Title Ins Agency | |
| Kirk Tracon | -- | Southern Utah Title |
Source: Public Records
Mortgage History
| Date | Status | Borrower | Loan Amount |
|---|---|---|---|
| Open | Clark Samuel R | $119,500 | |
| Previous Owner | Kirk Tracon | $173,597 |
Source: Public Records
Tax History Compared to Growth
Tax History
| Year | Tax Paid | Tax Assessment Tax Assessment Total Assessment is a certain percentage of the fair market value that is determined by local assessors to be the total taxable value of land and additions on the property. | Land | Improvement |
|---|---|---|---|---|
| 2025 | $1,604 | $241,725 | $59,400 | $182,325 |
| 2023 | $1,698 | $253,660 | $41,800 | $211,860 |
| 2022 | $2,245 | $258,720 | $41,800 | $216,920 |
| 2021 | $1,557 | $326,300 | $64,000 | $262,300 |
| 2020 | $1,444 | $285,000 | $60,000 | $225,000 |
| 2019 | $1,425 | $274,700 | $52,000 | $222,700 |
| 2018 | $1,407 | $140,085 | $0 | $0 |
| 2017 | $1,362 | $131,615 | $0 | $0 |
| 2016 | $1,417 | $126,665 | $0 | $0 |
| 2015 | $1,323 | $113,465 | $0 | $0 |
| 2014 | $1,241 | $107,085 | $0 | $0 |
Source: Public Records
Map
Nearby Homes
- 64 N Lee Ln
- 2990 E Riverside Dr Unit 26
- 2990 E Riverside Dr Unit 117
- 2990 E Riverside Dr Unit 173
- 2990 E Riverside Dr Unit 166
- 2990 E Riverside Dr Unit 3
- 2990 E Riverside Dr Unit 157
- 2990 E Riverside Dr
- 2990 E Riverside Dr Unit 31
- 2752 E 50 St S
- 2930 E 450 N Unit F6
- 2880 E 380 N
- 240 N Sunflower Dr
- 240 N Sunflower Dr Unit 42
- 2843 E 410 St N
- 2721 E Riverside Dr
- 2541 E 90 S
- 3 2450 St E Unit 3
- 320 N Sunflower Dr Unit 10
- 2801 E 450 N Unit 324