2948 Harmon Quarters Rd Prosperity, SC 29127
Estimated Value: $419,000 - $710,000
About This Home
This home is located at 2948 Harmon Quarters Rd, Prosperity, SC 29127 and is currently estimated at $527,706, approximately $517 per square foot. 2948 Harmon Quarters Rd is a home located in Newberry County with nearby schools including Prosperity-Rikard Elementary School, Mid-Carolina Middle School, and Mid-Carolina High School.
Ownership History
We collect this data history from publicly available records. To have your information removed, we recommend requesting removal directly through your county’s website.
Purchase Details
Home Financials for this Owner
Home Financials are based on the most recent Mortgage that was taken out on this home.Purchase Details
Home Financials for this Owner
Home Financials are based on the most recent Mortgage that was taken out on this home.Purchase Details
Home Financials for this Owner
Home Financials are based on the most recent Mortgage that was taken out on this home.Purchase History
We collect this data history from publicly available records. To have your information removed, we recommend requesting removal directly through your county’s website.
| Date | Buyer | Sale Price | Title Company |
|---|---|---|---|
| $358,000 | -- | ||
| $250,000 | -- | ||
| $300,000 | -- |
Mortgage History
We collect this data history from publicly available records. To have your information removed, we recommend requesting removal directly through your county’s website.
| Date | Status | Borrower | Loan Amount |
|---|---|---|---|
| Open | $264,000 | ||
| Previous Owner | $225,000 | ||
| Previous Owner | $240,000 |
Tax History
We collect this data history from publicly available records. To have your information removed, we recommend requesting removal directly through your county’s website.
| Year | Tax Paid | Tax Assessment Tax Assessment Total Assessment is a certain percentage of the fair market value that is determined by local assessors to be the total taxable value of land and additions on the property. | Land | Improvement |
|---|---|---|---|---|
| 2025 | $2,560 | $13,993 | $4,192 | $9,801 |
| 2024 | $2,312 | $12,168 | $4,624 | $7,544 |
| 2023 | $2,288 | $12,168 | $4,624 | $7,544 |
| 2022 | $2,264 | $12,168 | $4,624 | $7,544 |
| 2021 | $2,276 | $12,168 | $4,624 | $7,544 |
| 2020 | $2,276 | $12,168 | $4,624 | $7,544 |
| 2019 | $2,300 | $12,168 | $4,624 | $7,544 |
| 2018 | $2,182 | $11,180 | $4,624 | $6,556 |
| 2017 | $2,437 | $14,622 | $6,936 | $7,686 |
| 2016 | $1,893 | $9,748 | $4,624 | $5,124 |
| 2015 | -- | $0 | $0 | $0 |
| 2014 | -- | $9,748 | $0 | $0 |
| 2013 | -- | $9,748 | $0 | $0 |
| 2012 | -- | $9,380 | $0 | $0 |
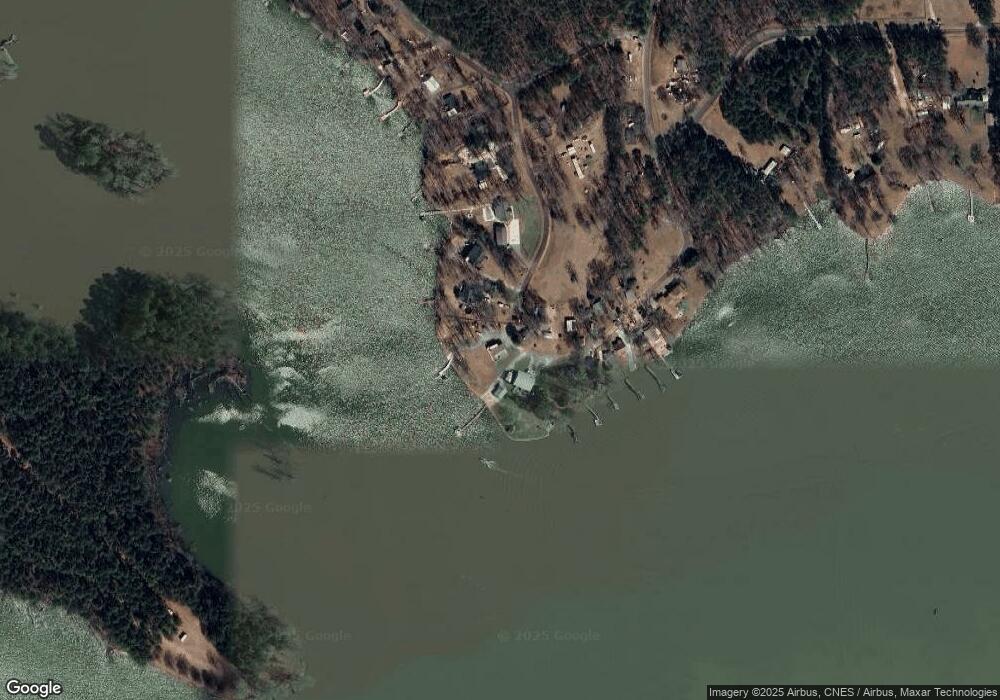
Map
- 2910 Harmon Quarters Rd
- 15 Bell-Tel Dr
- 72 Sunshine Point
- 117 Peninsula Ct
- TBD Fannie Black Rd
- 1011 Harbor View Dr
- 447 Harbor View Dr
- 704 Harborview Dr
- 773 Harbor View Dr
- 287 Maple Knoll Ct
- 444 Maple Knoll Rd
- 0 Maple Knoll Rd
- 720 State Route 391
- 3934 Stoney Hill Rd
- 912 Lakewood Dr
- 0 Bark Ave
- 1046 Blacksgate E
- 938 Blacksgate E
- 1724 Gold Nugget Point
- 0 Tailers Trail
- 2928 Harmon Quarters Rd
- 5 Bell Tel
- 15 Bell Tel
- 2891 Harmon Quarters Rd
- 2900 Harmon Quarters Rd
- 49 Bell-Tel Dr
- 2871 Harmon Quarters Rd
- 2871 Harmon Quarters Rd
- 49 Bell Tel
- 2872 Harmon Quarters Rd
- 2888 Harmon Quarters Rd
- 2868 Harmon Quarters Rd
- 2860 Harmon Quarters Rd
- 93 Bell Tel
- 2836 Harmon Quarters Rd
- 108 Bell Tel
- 108 Bell-Tel Dr
- 163 Bell Tel
- 163 Belltel Dr
- 2735 Harmon Quarters Rd
Ask me questions while you tour the home.