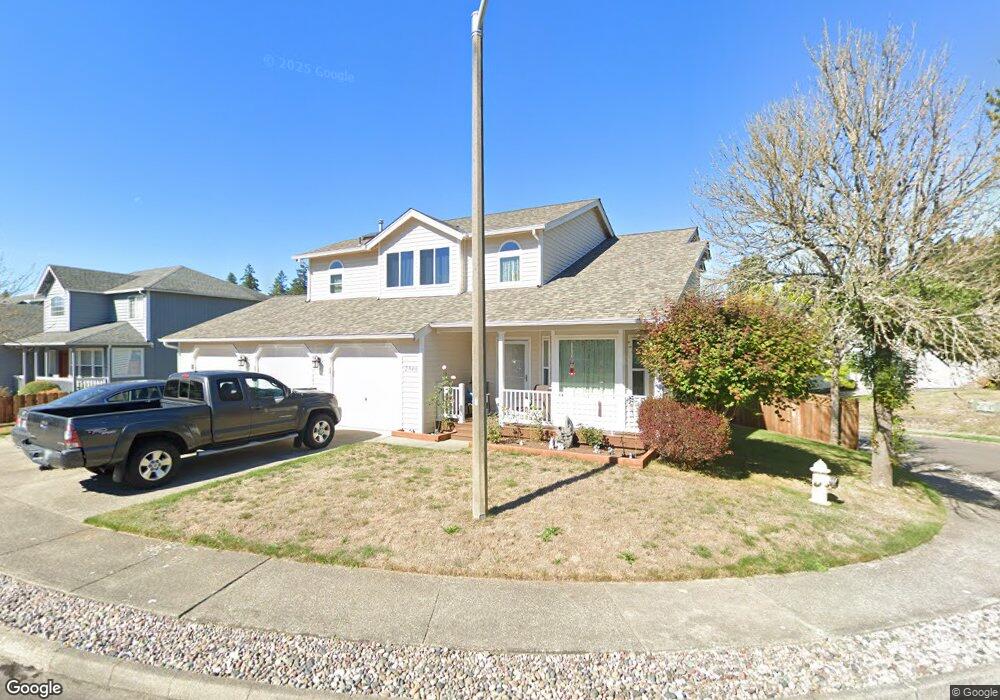
2948 Lowren Loop Port Orchard, WA 98366
Estimated Value: $520,000 - $540,000
4
Beds
3
Baths
1,917
Sq Ft
$276/Sq Ft
Est. Value
About This Home
This home is located at 2948 Lowren Loop, Port Orchard, WA 98366 and is currently estimated at $528,786, approximately $275 per square foot. 2948 Lowren Loop is a home located in Kitsap County with nearby schools including East Port Orchard Elementary School, Marcus Whitman Middle School, and South Kitsap High School.
Ownership History
Date
Name
Owned For
Owner Type
Purchase Details
Closed on
Jan 25, 2002
Sold by
Capstone Homes Inc
Bought by
Houtz Christian and Houtz Robin K
Current Estimated Value
Home Financials for this Owner
Home Financials are based on the most recent Mortgage that was taken out on this home.
Original Mortgage
$169,218
Outstanding Balance
$70,513
Interest Rate
7.17%
Mortgage Type
VA
Estimated Equity
$458,273
Create a Home Valuation Report for This Property
The Home Valuation Report is an in-depth analysis detailing your home's value as well as a comparison with similar homes in the area
Home Values in the Area
Average Home Value in this Area
Purchase History
| Date | Buyer | Sale Price | Title Company |
|---|---|---|---|
| Houtz Christian | $165,900 | Transnation Title Ins Co |
Source: Public Records
Mortgage History
| Date | Status | Borrower | Loan Amount |
|---|---|---|---|
| Open | Houtz Christian | $169,218 |
Source: Public Records
Tax History Compared to Growth
Tax History
| Year | Tax Paid | Tax Assessment Tax Assessment Total Assessment is a certain percentage of the fair market value that is determined by local assessors to be the total taxable value of land and additions on the property. | Land | Improvement |
|---|---|---|---|---|
| 2026 | $4,178 | $489,730 | $65,330 | $424,400 |
| 2025 | $4,178 | $478,770 | $59,230 | $419,540 |
| 2024 | $4,033 | $478,770 | $59,230 | $419,540 |
| 2023 | $4,029 | $478,770 | $59,230 | $419,540 |
| 2022 | $3,921 | $392,250 | $55,310 | $336,940 |
| 2021 | $3,659 | $346,960 | $51,400 | $295,560 |
| 2020 | $3,596 | $330,620 | $48,950 | $281,670 |
| 2019 | $2,997 | $301,670 | $47,560 | $254,110 |
| 2018 | $3,114 | $240,940 | $47,560 | $193,380 |
| 2017 | $2,640 | $240,940 | $47,560 | $193,380 |
| 2016 | $2,530 | $213,770 | $47,560 | $166,210 |
| 2015 | $2,434 | $208,980 | $47,560 | $161,420 |
| 2014 | -- | $205,780 | $47,560 | $158,220 |
| 2013 | -- | $213,150 | $50,060 | $163,090 |
Source: Public Records
Map
Nearby Homes
- 2949 SE Mile Hill Dr Unit C-2
- 4990 Mile Hill Dr
- 123 E 4th St
- 190 SE Mile Hill Dr
- 0 Wendell Ave SE
- 3817 SE Horstman Rd
- 3140 E Washington St
- 0 E Washington St Unit NWM2337936
- 22 Lots E Washington St
- 3589 SE Pine Tree Dr
- 1663 Harrison Ave SE
- 0 Beach Dr E Unit NWM2448019
- 0 Beach Dr E Unit NWM2139946
- 1703 Harrison Ave SE
- 4010 SE Lovell St
- 3900 SE Mile Hill Dr
- 4233 SE Horsehead Way
- 3930 SE Mile Hill Dr
- 343 Farragut Ave N
- 659 SE Olga Cir
- 2950 Lowren Loop
- 2940 Lowren Loop
- 2951 Lowren Loop
- 2943 Lowren Loop
- 2945 Lowren Loop
- 2941 Lowren Loop
- 2949 Lowren Loop
- 2939 Lowren Loop
- 2947 Lowren Loop
- 1100 Olney Ave SE
- 2993 Sprague St
- 1150 Olney Ave
- 2957 Lowren Loop
- 1100 Olney Ave E
- 1100 Olney Ave
- 2991 Sprague St
- 1200 Olney Ave SE
- 2996 Lowren Loop