Estimated Value: $220,893 - $245,000
3
Beds
2
Baths
1,375
Sq Ft
$169/Sq Ft
Est. Value
About This Home
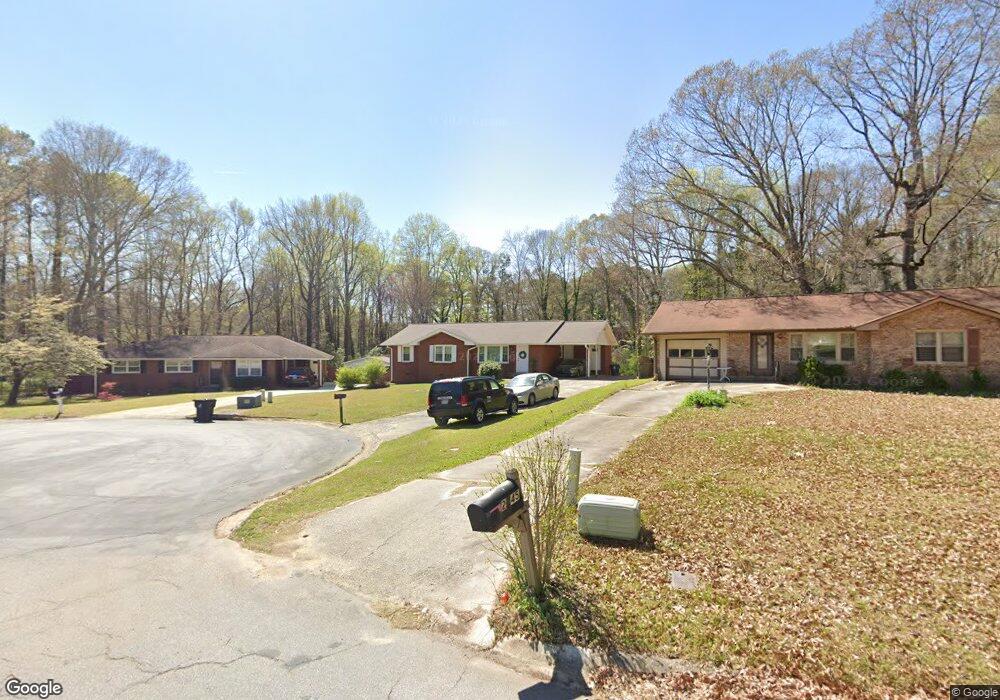
This home is located at 2949 Bobolink Dr, Rex, GA 30273 and is currently estimated at $232,473, approximately $169 per square foot. 2949 Bobolink Dr is a home located in Clayton County with nearby schools including William M. Mcgarrah Elementary School, Rex Mill Middle School, and Mount Zion High School.
Ownership History
Date
Name
Owned For
Owner Type
Purchase Details
Closed on
Apr 29, 2019
Sold by
Theng Real Estate Llc
Bought by
Reese Mary C
Current Estimated Value
Home Financials for this Owner
Home Financials are based on the most recent Mortgage that was taken out on this home.
Original Mortgage
$123,900
Outstanding Balance
$107,796
Interest Rate
4%
Mortgage Type
New Conventional
Estimated Equity
$124,677
Purchase Details
Closed on
May 2, 2011
Sold by
Federal Home Loan Mortgage Corporation
Bought by
Theng Real Estate Llc
Purchase Details
Closed on
Dec 7, 2010
Sold by
Bank Of America
Bought by
Federal Home Loan Mortgage Corporation
Purchase Details
Closed on
Jun 30, 2003
Sold by
Vincent Thomas E
Bought by
Rowland Ralph E
Home Financials for this Owner
Home Financials are based on the most recent Mortgage that was taken out on this home.
Original Mortgage
$105,730
Interest Rate
5.16%
Mortgage Type
New Conventional
Create a Home Valuation Report for This Property
The Home Valuation Report is an in-depth analysis detailing your home's value as well as a comparison with similar homes in the area
Home Values in the Area
Average Home Value in this Area
Purchase History
| Date | Buyer | Sale Price | Title Company |
|---|---|---|---|
| Reese Mary C | $123,900 | -- | |
| Theng Real Estate Llc | -- | -- | |
| Federal Home Loan Mortgage Corporation | -- | -- | |
| Bank Of America | $17,013 | -- | |
| Rowland Ralph E | $109,000 | -- |
Source: Public Records
Mortgage History
| Date | Status | Borrower | Loan Amount |
|---|---|---|---|
| Open | Reese Mary C | $123,900 | |
| Previous Owner | Rowland Ralph E | $105,730 |
Source: Public Records
Tax History
| Year | Tax Paid | Tax Assessment Tax Assessment Total Assessment is a certain percentage of the fair market value that is determined by local assessors to be the total taxable value of land and additions on the property. | Land | Improvement |
|---|---|---|---|---|
| 2025 | $1,630 | $97,200 | $7,200 | $90,000 |
| 2024 | $1,674 | $96,240 | $7,200 | $89,040 |
| 2023 | $1,144 | $97,320 | $7,200 | $90,120 |
| 2022 | $1,212 | $72,960 | $7,200 | $65,760 |
| 2021 | $960 | $59,240 | $7,200 | $52,040 |
| 2020 | $766 | $48,325 | $7,200 | $41,125 |
| 2019 | $1,374 | $33,847 | $6,400 | $27,447 |
| 2018 | $1,040 | $25,606 | $6,400 | $19,206 |
| 2017 | $1,042 | $25,606 | $6,400 | $19,206 |
| 2016 | $886 | $25,606 | $6,400 | $19,206 |
| 2015 | $804 | $0 | $0 | $0 |
| 2014 | $961 | $24,174 | $6,400 | $17,774 |
Source: Public Records
Map
Nearby Homes
- 3003 Menlo Park Dr
- 6493 Menlo Way Unit 3
- 6485 Bobolink Ct
- 6498 Carolyn Ct
- 6486 Aquila Dr
- 6697 Cambridge Dr
- 2783 Mill Lake Way
- 2845 Heritage Ln
- 6692 Cambridge Dr
- 6354 Warbler Ct
- 6350 Warbler Ct
- 6362 Warbler Ct
- 6348 Towhee Way
- 6357 Towhee Way
- 6366 Warbler Ct
- 6342 Warbler Ct
- 6371 Towhee Way
- 6359 Towhee Way
- 6637 Bedford Rd Unit 2
- 6355 Towhee Way
- 2953 Bobolink Dr
- 2945 Bobolink Dr Unit 1
- 6559 Bobolink Ct
- 2959 Bobolink Dr Unit 1
- 2970 Bobolink Dr
- 2965 Bobolink Dr
- 6553 Bobolink Ct
- 2973 Bobolink Dr
- 2980 Bobolink Dr
- 6574 Katie Ln
- 6566 Katie Ln
- 6584 Katie Ln
- 2964 Bretton Dr
- 2955 Menlo Park Dr Unit 3
- 2972 Bretton Dr
- 2947 Menlo Park Dr Unit 3
- 2956 Bretton Dr
- 2965 Menlo Park Dr Unit 3
- 2939 Menlo Park Dr Unit 3
- 2980 Bretton Dr
Your Personal Tour Guide
Ask me questions while you tour the home.