29495 Flat Run Rd Danville, OH 43014
Estimated Value: $362,361 - $378,000
3
Beds
2
Baths
1,716
Sq Ft
$216/Sq Ft
Est. Value
About This Home
This home is located at 29495 Flat Run Rd, Danville, OH 43014 and is currently estimated at $370,181, approximately $215 per square foot. 29495 Flat Run Rd is a home located in Knox County with nearby schools including Danville Elementary School, Danville Middle School, and Danville High School.
Ownership History
Date
Name
Owned For
Owner Type
Purchase Details
Closed on
Jul 24, 2001
Sold by
Cooper Troy A and Cooper Ellen A
Bought by
Lashley Mitchell L and Lashley Chri
Current Estimated Value
Purchase Details
Closed on
Nov 25, 1998
Sold by
Bartkowiak Rose Barbara
Bought by
Cooper Troy A and Cooper Ellen A
Purchase Details
Closed on
Sep 10, 1998
Sold by
Bartkowiak Stanley A and Bartkowiak Ro
Bought by
Bartkowiak Rose Barbara
Purchase Details
Closed on
Mar 15, 1995
Sold by
Bartkowiak Stanley A
Bought by
Bartkowiak Stanley A and Bartkowiak Ro
Create a Home Valuation Report for This Property
The Home Valuation Report is an in-depth analysis detailing your home's value as well as a comparison with similar homes in the area
Home Values in the Area
Average Home Value in this Area
Purchase History
| Date | Buyer | Sale Price | Title Company |
|---|---|---|---|
| Lashley Mitchell L | $93,000 | -- | |
| Cooper Troy A | $85,000 | -- | |
| Bartkowiak Rose Barbara | -- | -- | |
| Bartkowiak Stanley A | -- | -- |
Source: Public Records
Tax History Compared to Growth
Tax History
| Year | Tax Paid | Tax Assessment Tax Assessment Total Assessment is a certain percentage of the fair market value that is determined by local assessors to be the total taxable value of land and additions on the property. | Land | Improvement |
|---|---|---|---|---|
| 2024 | $2,493 | $73,160 | $26,540 | $46,620 |
| 2023 | $2,493 | $73,160 | $26,540 | $46,620 |
| 2022 | $2,240 | $56,280 | $20,420 | $35,860 |
| 2021 | $2,240 | $56,280 | $20,420 | $35,860 |
| 2020 | $2,108 | $56,280 | $20,420 | $35,860 |
| 2019 | $1,840 | $46,230 | $16,040 | $30,190 |
| 2018 | $1,852 | $46,230 | $16,040 | $30,190 |
| 2017 | $1,808 | $46,230 | $16,040 | $30,190 |
| 2016 | $1,634 | $40,200 | $13,950 | $26,250 |
| 2015 | $1,595 | $40,200 | $13,950 | $26,250 |
| 2014 | $1,556 | $40,200 | $13,950 | $26,250 |
| 2013 | $1,539 | $37,790 | $12,690 | $25,100 |
Source: Public Records
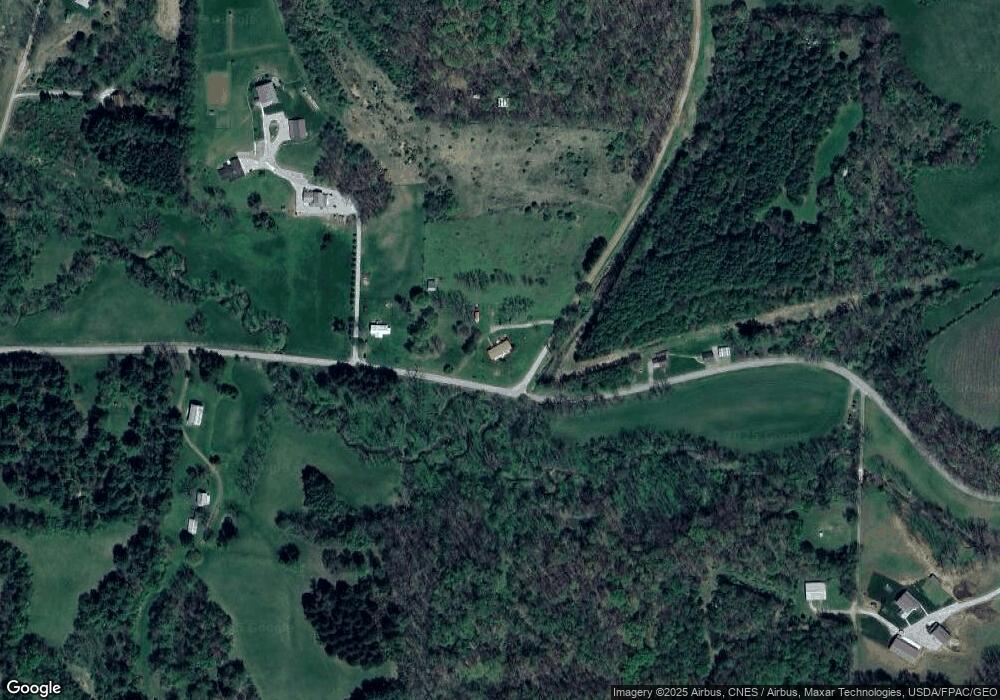
Map
Nearby Homes