
Seller's Agent in 2026
Miguel Ruiz
Baird Warner
(847) 392-1855
7 in this area
17 Total Sales
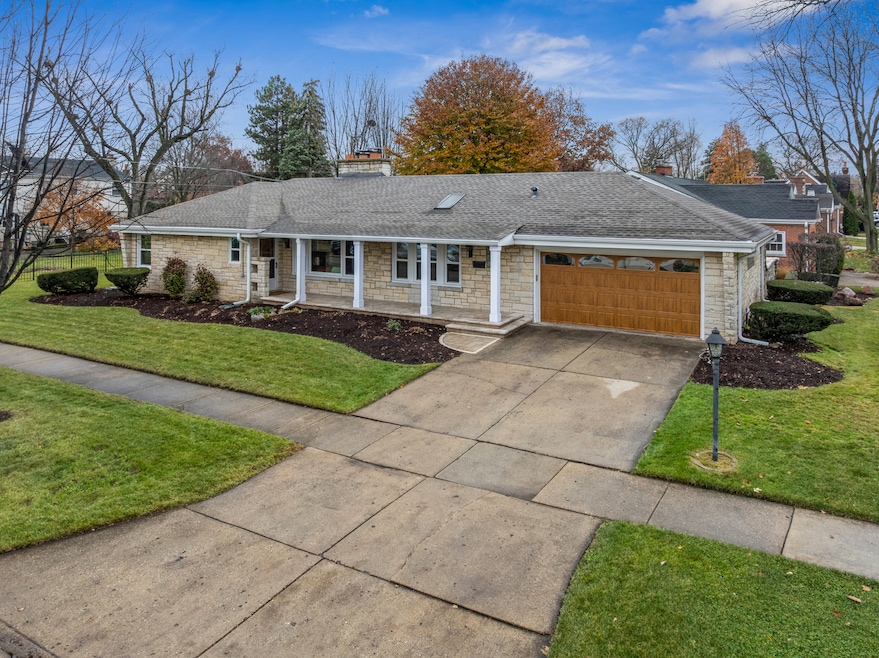
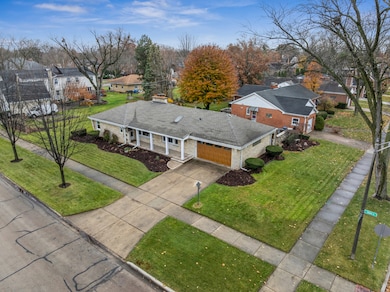
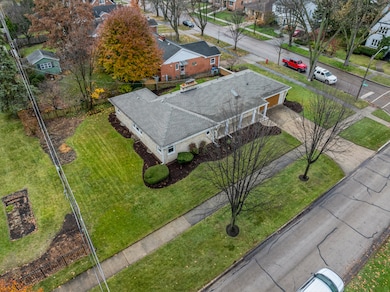
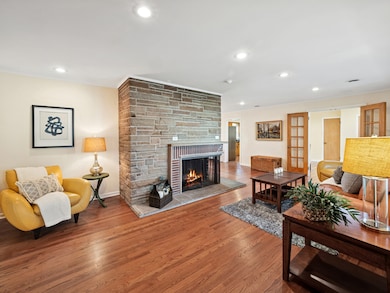
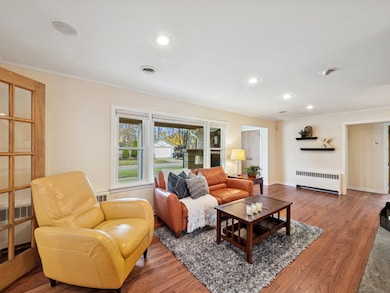

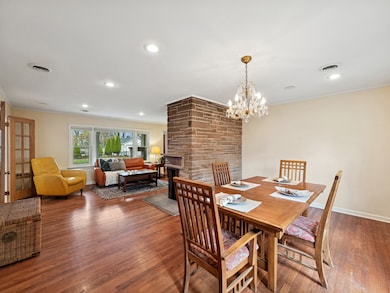
It's waiting for you! This charming 3-bedroom, 2-bathroom home perfectly blends comfort, quality, and convenience. Located in the highly sought-after Cumberland subdivision, this corner-lot property sits on a quiet, tree-lined street and has been meticulously maintained with extensive recent upgrades. Step inside to a bright & spacious living room featuring a wood-burning fireplace, creating a cozy and welcoming space to relax or gather with friends & family. The open dining area flows seamlessly into the updated kitchen, offering plenty of natural light and great space for entertaining. The kitchen includes new stainless steel appliances (Refrigerator & double oven - Oct 2025) along with an island with prep space, overlooking the breakfast nook. Walk out from the dining room directly to the backyard patio, providing easy access for indoor/outdoor entertaining. Whether it's summer BBQs, morning coffee, or evening relaxation, this layout makes everyday living enjoyable. The finished full basement adds even more versatility with a large family / recreation room, a second fireplace, along with a bonus room ideal for a home office, fitness area, or create your new Zoom Room. This home has seen major updates for true peace of mind; including a new Roof (July 2024) with oversized gutters (Aug 2024), Front Porch Columns (Sept 2024), Stone Front Porch (July 2025), New Central Air (Oct 2025), and New Washer & Dryer (Oct 2025). Previous upgrades include windows replaced in 2014 and a new garage door in 2015. Every big-ticket item has been handled - just move in & enjoy! The location can't be beat. The Cumberland neighborhood is one of Des Plaines' most desirable areas, loved for its charm, mature trees, and walkability. You're just steps from Cornell Park, Kutchen & Teton Parks, Chippewa Pool, and excellent schools-Cumberland Elementary and Chippewa Middle School. The Cumberland Metra Station is only a short walk away, making for an easy commute. Shopping, dining, and major highways are also conveniently nearby. Don't let this one slip through your fingers as this property is a true gem!
| Date | Type | Sale Price | Title Company |
|---|---|---|---|
| Warranty Deed | $533,000 | None Listed On Document | |
| Quit Claim Deed | -- | None Listed On Document | |
| Interfamily Deed Transfer | -- | Precision Title Company | |
| Interfamily Deed Transfer | -- | None Available | |
| Interfamily Deed Transfer | -- | -- | |
| Interfamily Deed Transfer | -- | -- |
| Date | Status | Loan Amount | Loan Type |
|---|---|---|---|
| Open | $479,700 | New Conventional | |
| Previous Owner | $264,000 | New Conventional |
| Date | Event | Price | List to Sale | Price per Sq Ft |
|---|---|---|---|---|
| 01/29/2026 01/29/26 | Sold | $533,000 | -1.3% | $281 / Sq Ft |
| 12/31/2025 12/31/25 | Pending | -- | -- | -- |
| 11/28/2025 11/28/25 | For Sale | $540,000 | -- | $285 / Sq Ft |
| Year | Tax Paid | Tax Assessment Tax Assessment Total Assessment is a certain percentage of the fair market value that is determined by local assessors to be the total taxable value of land and additions on the property. | Land | Improvement |
|---|---|---|---|---|
| 2025 | $10,726 | $46,000 | $9,829 | $36,171 |
| 2024 | $10,726 | $44,000 | $8,355 | $35,645 |
| 2023 | $10,442 | $44,000 | $8,355 | $35,645 |
| 2022 | $10,442 | $44,000 | $8,355 | $35,645 |
| 2021 | $8,336 | $30,449 | $6,880 | $23,569 |
| 2020 | $8,264 | $30,449 | $6,880 | $23,569 |
| 2019 | $8,284 | $34,213 | $6,880 | $27,333 |
| 2018 | $9,287 | $34,488 | $5,897 | $28,591 |
| 2017 | $9,140 | $34,488 | $5,897 | $28,591 |
| 2016 | $8,890 | $34,488 | $5,897 | $28,591 |
| 2015 | $6,493 | $24,101 | $5,160 | $18,941 |
| 2014 | $7,384 | $27,521 | $5,160 | $22,361 |
| 2013 | $7,183 | $27,521 | $5,160 | $22,361 |
Seller's Agent in 2026
Miguel Ruiz
Baird Warner
(847) 392-1855
7 in this area
17 Total Sales
Buyer's Agent in 2026
Erica Cuneen
Beyond Properties Realty Group
(708) 220-2025
2 in this area
325 Total Sales
Source: Midwest Real Estate Data (MRED)
MLS Number: 12516996
APN: 09-07-405-034-0000
Disclaimer: Certain information contained herein is derived from information provided by parties other than Homes.com. All information provided is deemed reliable, but is not guaranteed to be accurate and should be independently verified.
![]() Based on information submitted to the MLS GRID. All data is obtained from various sources and may not have been verified by broker or MLS GRID. Supplied Open House Information is subject to change without notice. All information should be independently reviewed and verified for accuracy. Properties may or may not be listed by the office/agent presenting the information. Some IDX listings have been excluded from this website.
Based on information submitted to the MLS GRID. All data is obtained from various sources and may not have been verified by broker or MLS GRID. Supplied Open House Information is subject to change without notice. All information should be independently reviewed and verified for accuracy. Properties may or may not be listed by the office/agent presenting the information. Some IDX listings have been excluded from this website.
Based on information submitted to the MLS GRID
Ask me questions while you tour the home.