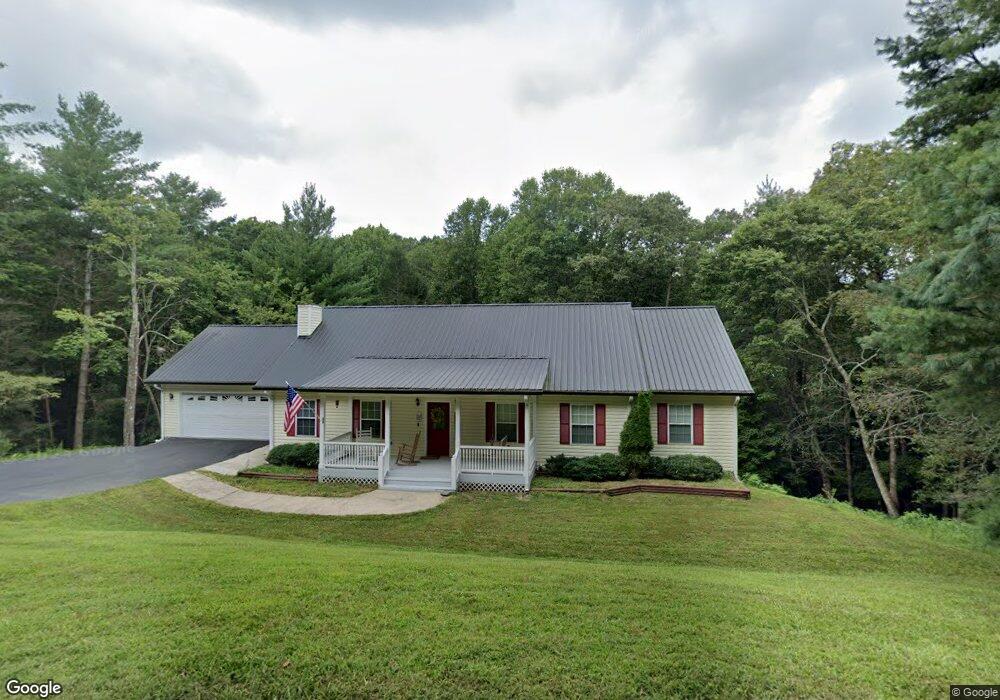
295 Carson Cove Rd Unit Lot 12 Ellijay, GA 30540
Estimated Value: $536,000 - $709,000
5
Beds
3
Baths
3,480
Sq Ft
$174/Sq Ft
Est. Value
About This Home
This home is located at 295 Carson Cove Rd Unit Lot 12, Ellijay, GA 30540 and is currently estimated at $605,114, approximately $173 per square foot. 295 Carson Cove Rd Unit Lot 12 is a home located in Gilmer County with nearby schools including Ellijay Elementary School, Clear Creek Elementary School, and Clear Creek Middle School.
Ownership History
Date
Name
Owned For
Owner Type
Purchase Details
Closed on
Dec 30, 2021
Sold by
Macgregor Robert
Bought by
Aulick James Walter and Aulick Margaret Ann
Current Estimated Value
Home Financials for this Owner
Home Financials are based on the most recent Mortgage that was taken out on this home.
Original Mortgage
$440,300
Outstanding Balance
$402,952
Interest Rate
3.05%
Mortgage Type
VA
Estimated Equity
$202,162
Purchase Details
Closed on
May 31, 2018
Sold by
Berry Christopher Calvin
Bought by
Macgregor Robert and Macgregor Yvette
Purchase Details
Closed on
Jul 18, 2001
Sold by
Berry Stanley
Bought by
Berry Christopher C
Purchase Details
Closed on
Jan 20, 1999
Sold by
Berry Stanley Etal
Bought by
Berry Stanley
Create a Home Valuation Report for This Property
The Home Valuation Report is an in-depth analysis detailing your home's value as well as a comparison with similar homes in the area
Home Values in the Area
Average Home Value in this Area
Purchase History
| Date | Buyer | Sale Price | Title Company |
|---|---|---|---|
| Aulick James Walter | $425,000 | -- | |
| Macgregor Robert | $260,000 | -- | |
| Berry Christopher C | -- | -- | |
| Berry Stanley | $14,500 | -- |
Source: Public Records
Mortgage History
| Date | Status | Borrower | Loan Amount |
|---|---|---|---|
| Open | Aulick James Walter | $440,300 |
Source: Public Records
Tax History Compared to Growth
Tax History
| Year | Tax Paid | Tax Assessment Tax Assessment Total Assessment is a certain percentage of the fair market value that is determined by local assessors to be the total taxable value of land and additions on the property. | Land | Improvement |
|---|---|---|---|---|
| 2024 | $719 | $171,840 | $20,160 | $151,680 |
| 2023 | $739 | $171,840 | $20,160 | $151,680 |
| 2022 | $769 | $150,960 | $20,160 | $130,800 |
| 2021 | $2,233 | $119,960 | $20,160 | $99,800 |
| 2020 | $2,373 | $112,680 | $20,160 | $92,520 |
| 2019 | $2,181 | $98,160 | $15,120 | $83,040 |
| 2018 | $2,097 | $103,200 | $20,160 | $83,040 |
| 2017 | $2,095 | $92,600 | $20,160 | $72,440 |
| 2016 | $2,154 | $93,440 | $20,160 | $73,280 |
| 2015 | $1,986 | $85,400 | $20,160 | $65,240 |
| 2014 | $2,062 | $85,200 | $20,160 | $65,040 |
| 2013 | -- | $88,600 | $20,160 | $68,440 |
Source: Public Records
Map
Nearby Homes
- 44 W D Ct
- 122 D j Ln
- 0 Blazing Star Rd
- 12.22ac Kell's Ridge Ct
- TR1TR3 Flat Branch Trail
- 659 Kells Ridge Dr
- 659 Kells Ridge Dr Unit 14
- 414 Watersong Trail
- 414 Watersong Trail Unit 12
- 353 Kells Ridge Ct
- 795 Kells Ridge Dr
- 371 Abbott Top Rd
- 3477 Boardtown Rd
- 14 Abbott Mill Rd
- Lot 48 Abbott Mill Rd
- 12 N Ridge Dr
- 658 Pen Dr
- 293 James Dr
- 295 Carson Cove Rd
- 295 Carson Cove Rd
- 295 Carson Cove Unit 12
- 87 Carson Cove Rd
- 87 Carson Cove
- 101 Wd Ct
- 86 Carson Cove Rd
- 365 Carson Cove Rd
- 44 Wd Ct
- 109 Wd Ct
- 57 Carson Cove Rd
- W W D Ct
- 161 W D Ct
- 161 Wd Ct
- 22 Carson Cove Rd
- 22 Carson Cove Rd
- 22 Carson Cove Rd
- 415 Carson Cove Rd
- 41 Carson Cove Rd
- 1744 Weeks Rd