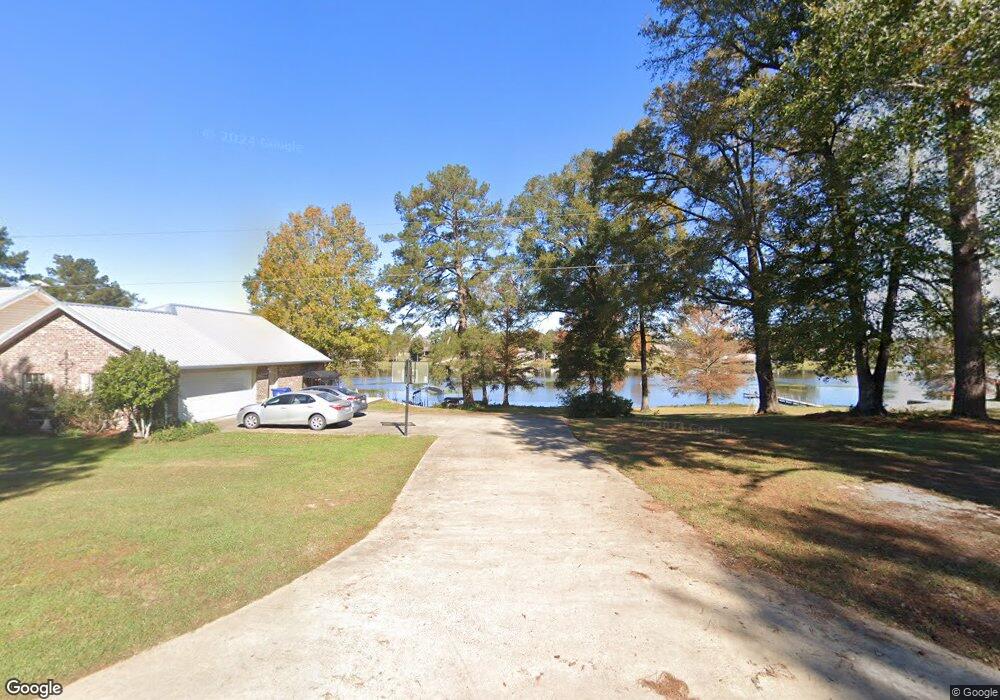
295 Conerly Loop Anacoco, LA 71403
Estimated Value: $271,000 - $357,000
4
Beds
3
Baths
2,870
Sq Ft
$115/Sq Ft
Est. Value
About This Home
This home is located at 295 Conerly Loop, Anacoco, LA 71403 and is currently estimated at $328,660, approximately $114 per square foot. 295 Conerly Loop is a home located in Vernon Parish.
Ownership History
Date
Name
Owned For
Owner Type
Purchase Details
Closed on
Mar 27, 2023
Sold by
Nelson Scott Andrew
Bought by
Evans Edgar and Evans Alycia
Current Estimated Value
Home Financials for this Owner
Home Financials are based on the most recent Mortgage that was taken out on this home.
Original Mortgage
$189,000
Outstanding Balance
$182,192
Interest Rate
6.12%
Mortgage Type
New Conventional
Estimated Equity
$146,468
Purchase Details
Closed on
Oct 18, 2021
Sold by
Owen Joel D
Bought by
Nelson Scott Andrew and Nelson Alli Sterling
Home Financials for this Owner
Home Financials are based on the most recent Mortgage that was taken out on this home.
Original Mortgage
$223,870
Interest Rate
2.8%
Mortgage Type
New Conventional
Purchase Details
Closed on
Feb 1, 2013
Sold by
Weeks Charles R and Weeks Zelma S
Bought by
Owen Joel D and Owen Sherly D
Home Financials for this Owner
Home Financials are based on the most recent Mortgage that was taken out on this home.
Original Mortgage
$173,000
Interest Rate
3.38%
Mortgage Type
Stand Alone First
Create a Home Valuation Report for This Property
The Home Valuation Report is an in-depth analysis detailing your home's value as well as a comparison with similar homes in the area
Purchase History
| Date | Buyer | Sale Price | Title Company |
|---|---|---|---|
| Evans Edgar | $339,000 | -- | |
| Nelson Scott Andrew | -- | Fontenot Elvin C | |
| Owen Joel D | $220,000 | -- |
Source: Public Records
Mortgage History
| Date | Status | Borrower | Loan Amount |
|---|---|---|---|
| Open | Evans Edgar | $189,000 | |
| Previous Owner | Nelson Scott Andrew | $223,870 | |
| Previous Owner | Owen Joel D | $173,000 |
Source: Public Records
Tax History
| Year | Tax Paid | Tax Assessment Tax Assessment Total Assessment is a certain percentage of the fair market value that is determined by local assessors to be the total taxable value of land and additions on the property. | Land | Improvement |
|---|---|---|---|---|
| 2025 | $899 | $33,470 | $550 | $32,920 |
| 2024 | $910 | $33,470 | $550 | $32,920 |
| 2023 | $952 | $33,500 | $500 | $33,000 |
| 2022 | $2,883 | $21,660 | $500 | $21,160 |
| 2021 | $2,879 | $20,680 | $1,900 | $18,780 |
| 2020 | $2,813 | $20,680 | $1,900 | $18,780 |
| 2019 | $2,864 | $20,680 | $1,900 | $18,780 |
| 2018 | $2,905 | $20,680 | $1,900 | $18,780 |
| 2017 | $2,879 | $20,680 | $1,900 | $18,780 |
| 2015 | $2,875 | $19,800 | $1,020 | $18,780 |
| 2014 | $2,975 | $19,800 | $1,020 | $18,780 |
| 2013 | $3,099 | $20,960 | $1,020 | $19,940 |
Source: Public Records
Map
Nearby Homes
- 171 Colony Loop
- 1023 McConathy Rd
- 200 Steel Magnolia Ln
- 180 Dogwood Dr
- 760 Holly Grove Dr
- 105 Gazebo Ln
- 0 Tbd Land T3nr10w- Sec 10 Swnw Unit 20-450
- 437 Holton Harris Rd
- 121 Calvin St
- 315 Thaxton Landing Rd
- 194 Thaxton Landing Rd
- 227 Thaxton Landing Rd
- 326 Roy Clark Rd
- 0 Lotus Ln
- 0 Unit Lots 8, 9 & 10
- 4549 Main St
- 743 Lions Camp Rd
- 295 Ross Rd
- 0 Main St
- 201 Sandy Dr
- 279 Conerly Loop
- 357 Conerly Loop
- 207 Conerly Loop
- 753 McConathy Rd
- 111 Shady Ln
- 121 Shady Ln
- 265 Paradise Cove
- 175 Shady Ln
- 141 Franklin Dr
- 147 Mill Rd
- 812 McConathy Rd
- 197 Shady Ln
- 199 Shady Ln
- 209 Shady Ln
- 209 Shady Ln Unit Ln
- 214 Shady Ln
- 0 Tbd Paradise Cove
- 173 Mill Rd
- 187 Mill Rd
- 316 Colony Loop
Your Personal Tour Guide
Ask me questions while you tour the home.