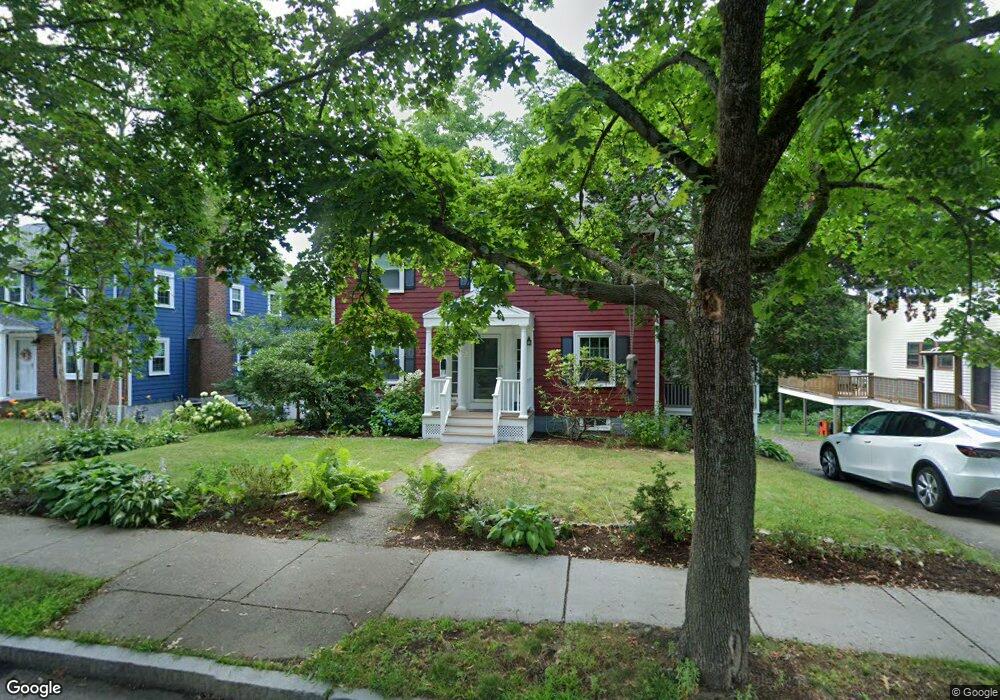
295 Cypress St Newton Center, MA 02459
Thompsonville NeighborhoodEstimated Value: $1,445,731 - $1,766,000
4
Beds
2
Baths
1,798
Sq Ft
$877/Sq Ft
Est. Value
About This Home
This home is located at 295 Cypress St, Newton Center, MA 02459 and is currently estimated at $1,577,683, approximately $877 per square foot. 295 Cypress St is a home located in Middlesex County with nearby schools including Bowen School, Oak Hill Middle School, and Newton South High School.
Ownership History
Date
Name
Owned For
Owner Type
Purchase Details
Closed on
Mar 1, 2023
Sold by
Schoenback Ft-2013 and Schoenback Schoenbeck
Bought by
Schoenbeck Lilac
Current Estimated Value
Home Financials for this Owner
Home Financials are based on the most recent Mortgage that was taken out on this home.
Original Mortgage
$599,000
Outstanding Balance
$576,012
Interest Rate
4.99%
Mortgage Type
Adjustable Rate Mortgage/ARM
Estimated Equity
$1,001,671
Purchase Details
Closed on
Nov 19, 2013
Sold by
Schoenbeck Lilac and Schoenbeck Brian
Bought by
Schoenbeck Ft and Schoenbeck Lilac
Purchase Details
Closed on
Mar 16, 2010
Sold by
Scanlan Richard J and Scanlan Mary A
Bought by
Schoenbeck Lilac and Schoenbeck Brian
Create a Home Valuation Report for This Property
The Home Valuation Report is an in-depth analysis detailing your home's value as well as a comparison with similar homes in the area
Home Values in the Area
Average Home Value in this Area
Purchase History
| Date | Buyer | Sale Price | Title Company |
|---|---|---|---|
| Schoenbeck Lilac | -- | None Available | |
| Schoenbeck Lilac | -- | None Available | |
| Schoenbeck Ft | -- | -- | |
| Schoenbeck Lilac | $646,500 | -- | |
| Schoenbeck Ft | -- | -- | |
| Schoenbeck Lilac | $646,500 | -- |
Source: Public Records
Mortgage History
| Date | Status | Borrower | Loan Amount |
|---|---|---|---|
| Open | Schoenbeck Lilac | $599,000 | |
| Closed | Schoenbeck Lilac | $599,000 | |
| Previous Owner | Schoenbeck Lilac | $410,000 | |
| Previous Owner | Schoenbeck Lilac | $417,000 | |
| Previous Owner | Schoenbeck Lilac | $417,000 |
Source: Public Records
Tax History Compared to Growth
Tax History
| Year | Tax Paid | Tax Assessment Tax Assessment Total Assessment is a certain percentage of the fair market value that is determined by local assessors to be the total taxable value of land and additions on the property. | Land | Improvement |
|---|---|---|---|---|
| 2025 | $11,260 | $1,149,000 | $942,700 | $206,300 |
| 2024 | $10,887 | $1,115,500 | $915,200 | $200,300 |
| 2023 | $10,254 | $1,007,300 | $693,900 | $313,400 |
| 2022 | $9,812 | $932,700 | $642,500 | $290,200 |
| 2021 | $9,468 | $879,900 | $606,100 | $273,800 |
| 2020 | $9,186 | $879,900 | $606,100 | $273,800 |
| 2019 | $8,927 | $854,300 | $588,400 | $265,900 |
| 2018 | $8,409 | $777,200 | $530,400 | $246,800 |
| 2017 | $8,153 | $733,200 | $500,400 | $232,800 |
| 2016 | $7,798 | $685,200 | $467,700 | $217,500 |
| 2015 | $7,435 | $640,400 | $437,100 | $203,300 |
Source: Public Records
Map
Nearby Homes
- 42 Bow Rd
- 20 Hamlet St
- 20 Hamlet St Unit 1
- 85 Dudley Rd
- 5 Halcyon Rd
- 41-43 John Unit B
- 21 Philbrick Rd
- 20 Bartlett Terrace
- 625 Boylston St
- 136 Dudley Rd
- 35 Haynes Rd
- 42 Sunhill Ln
- 628 Boylston St
- 250 Hammond Pond Pkwy Unit 1604N
- 250 Hammond Pond Pkwy Unit 1002N
- 250 Hammond Pond Pkwy Unit 614S
- 250 Hammond Pond Pkwy Unit 603S
- 250 Hammond Pond Pkwy Unit 615N
- 250 Hammond Pond Pkwy Unit 306N
- 38 Tanglewood Rd
- 289 Cypress St
- 301 Cypress St
- 285 Cypress St
- 285 Cypress St Unit R
- 290 Cypress St Unit 1
- 290 Cypress St
- 141 Jackson St
- 149 Jackson St
- 151 Jackson St
- 298 Cypress St
- 155 Jackson St
- 281 Cypress St
- 302 Cypress St
- 159 Jackson St
- 308 Cypress St
- 11 White Ave
- 275 Cypress St
- 131 Jackson St
- 23 White Ave
- 165 Jackson St