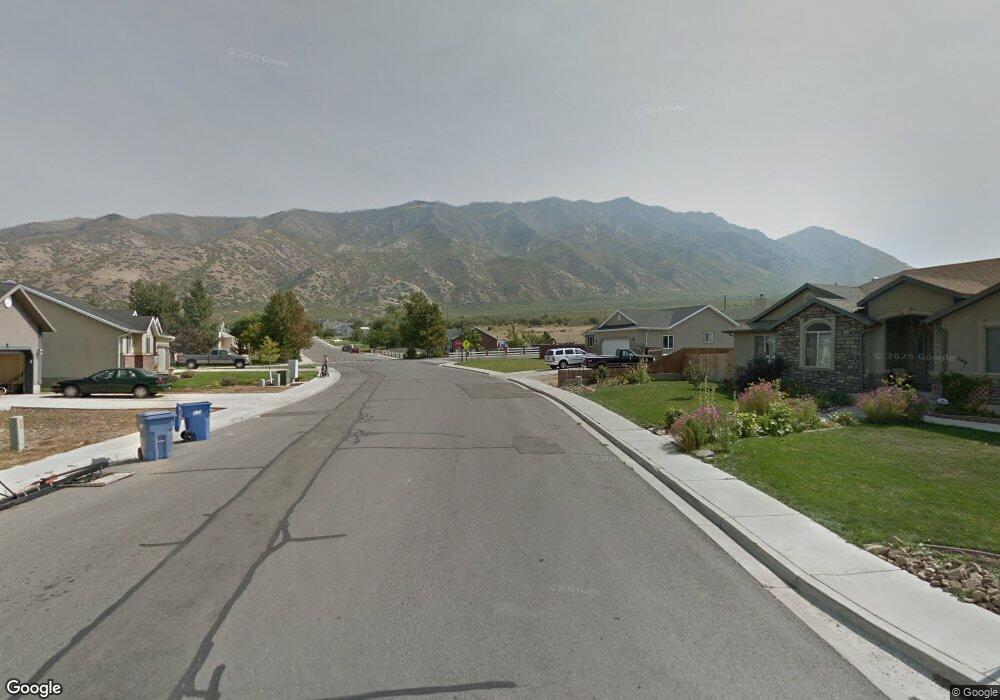
295 E 610 S Santaquin, UT 84655
Estimated Value: $409,220 - $455,000
3
Beds
1
Bath
2,204
Sq Ft
$196/Sq Ft
Est. Value
About This Home
This home is located at 295 E 610 S, Santaquin, UT 84655 and is currently estimated at $433,073, approximately $196 per square foot. 295 E 610 S is a home located in Utah County with nearby schools including Orchard Hills Elementary School, Payson Junior High School, and Mt. Nebo Middle.
Ownership History
Date
Name
Owned For
Owner Type
Purchase Details
Closed on
Feb 15, 2007
Sold by
Perry Amy Honeyman
Bought by
Harman Jeffrey
Current Estimated Value
Home Financials for this Owner
Home Financials are based on the most recent Mortgage that was taken out on this home.
Original Mortgage
$137,000
Outstanding Balance
$82,285
Interest Rate
6.21%
Mortgage Type
New Conventional
Estimated Equity
$350,788
Purchase Details
Closed on
Jan 18, 2005
Sold by
Omni Homes Llc
Bought by
Perry Amy Honeyman
Home Financials for this Owner
Home Financials are based on the most recent Mortgage that was taken out on this home.
Original Mortgage
$132,914
Interest Rate
5.67%
Mortgage Type
FHA
Purchase Details
Closed on
Jun 7, 2004
Sold by
East Bench Developers Llc
Bought by
Omni Santaquin Meadows Llc
Create a Home Valuation Report for This Property
The Home Valuation Report is an in-depth analysis detailing your home's value as well as a comparison with similar homes in the area
Home Values in the Area
Average Home Value in this Area
Purchase History
| Date | Buyer | Sale Price | Title Company |
|---|---|---|---|
| Harman Jeffrey | -- | Utah Standard Title | |
| Perry Amy Honeyman | -- | Title West Title Company | |
| Omni Homes Llc | -- | Title West Title Company | |
| Omni Santaquin Meadows Llc | -- | First American Title Co |
Source: Public Records
Mortgage History
| Date | Status | Borrower | Loan Amount |
|---|---|---|---|
| Open | Harman Jeffrey | $137,000 | |
| Previous Owner | Omni Homes Llc | $132,914 | |
| Closed | Perry Amy Honeyman | $7,974 |
Source: Public Records
Tax History
| Year | Tax Paid | Tax Assessment Tax Assessment Total Assessment is a certain percentage of the fair market value that is determined by local assessors to be the total taxable value of land and additions on the property. | Land | Improvement |
|---|---|---|---|---|
| 2025 | $1,942 | $206,745 | -- | -- |
| 2024 | $1,942 | $193,435 | $0 | $0 |
| 2023 | $2,030 | $202,785 | $0 | $0 |
| 2022 | $2,164 | $222,970 | $0 | $0 |
| 2021 | $1,776 | $283,600 | $75,900 | $207,700 |
| 2020 | $1,704 | $263,800 | $66,000 | $197,800 |
| 2019 | $1,488 | $235,600 | $62,600 | $173,000 |
| 2018 | $1,367 | $206,300 | $55,900 | $150,400 |
| 2017 | $1,336 | $107,745 | $0 | $0 |
| 2016 | $1,270 | $100,320 | $0 | $0 |
| 2015 | $1,163 | $90,145 | $0 | $0 |
| 2014 | $1,089 | $84,205 | $0 | $0 |
Source: Public Records
Map
Nearby Homes
Your Personal Tour Guide
Ask me questions while you tour the home.