Estimated Value: $408,039 - $556,000
3
Beds
2
Baths
1,273
Sq Ft
$384/Sq Ft
Est. Value
About This Home
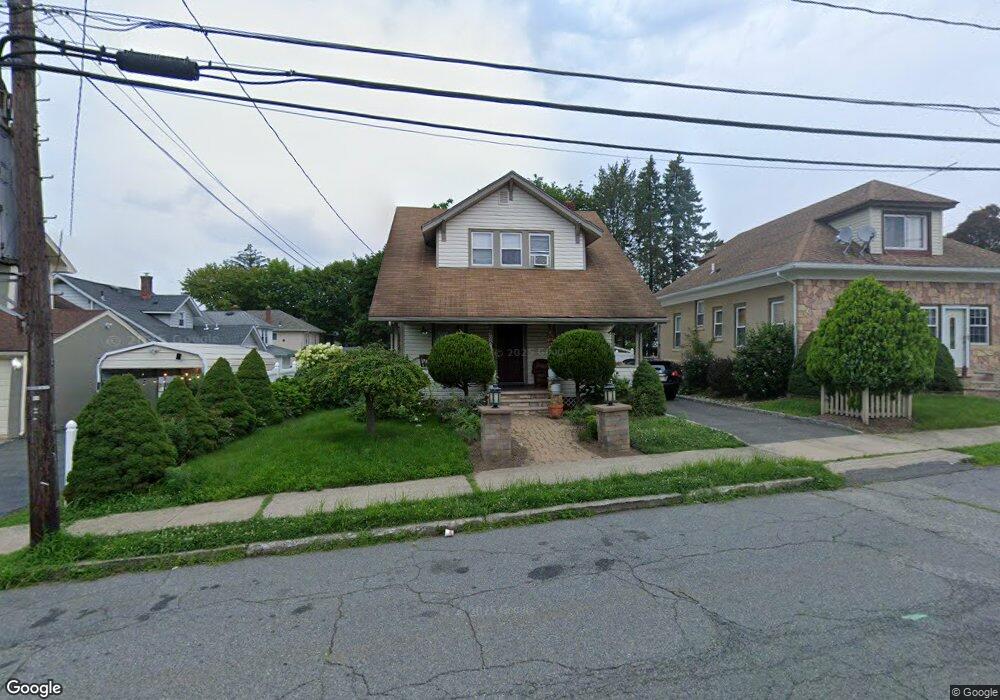
This home is located at 295 E Mcfarlan St, Dover, NJ 07801 and is currently estimated at $488,510, approximately $383 per square foot. 295 E Mcfarlan St is a home located in Morris County with nearby schools including Dover Middle School and Dover High School.
Ownership History
Date
Name
Owned For
Owner Type
Purchase Details
Closed on
Nov 2, 2005
Sold by
Chaparro Hector
Bought by
Melendez Jose Francisco and Melendez Leticia
Current Estimated Value
Home Financials for this Owner
Home Financials are based on the most recent Mortgage that was taken out on this home.
Original Mortgage
$284,000
Outstanding Balance
$156,842
Interest Rate
6.17%
Mortgage Type
New Conventional
Estimated Equity
$331,668
Purchase Details
Closed on
May 12, 1998
Sold by
Gonzalez Gilberto and Gonzalez Lydia
Bought by
Chaparro Hector and Chaparro Lizette
Home Financials for this Owner
Home Financials are based on the most recent Mortgage that was taken out on this home.
Original Mortgage
$100,000
Interest Rate
6.69%
Create a Home Valuation Report for This Property
The Home Valuation Report is an in-depth analysis detailing your home's value as well as a comparison with similar homes in the area
Home Values in the Area
Average Home Value in this Area
Purchase History
| Date | Buyer | Sale Price | Title Company |
|---|---|---|---|
| Melendez Jose Francisco | $355,000 | -- | |
| Chaparro Hector | $125,000 | Old Republic Natl Title Ins |
Source: Public Records
Mortgage History
| Date | Status | Borrower | Loan Amount |
|---|---|---|---|
| Open | Melendez Jose Francisco | $284,000 | |
| Previous Owner | Chaparro Hector | $100,000 |
Source: Public Records
Tax History
| Year | Tax Paid | Tax Assessment Tax Assessment Total Assessment is a certain percentage of the fair market value that is determined by local assessors to be the total taxable value of land and additions on the property. | Land | Improvement |
|---|---|---|---|---|
| 2025 | $6,683 | $204,200 | $86,400 | $117,800 |
| 2024 | $6,447 | $204,200 | $86,400 | $117,800 |
| 2023 | $6,447 | $204,200 | $86,400 | $117,800 |
| 2022 | $5,928 | $204,200 | $86,400 | $117,800 |
| 2021 | $5,928 | $204,200 | $86,400 | $117,800 |
| 2020 | $5,809 | $204,200 | $86,400 | $117,800 |
| 2019 | $5,569 | $204,200 | $86,400 | $117,800 |
| 2018 | $5,262 | $204,200 | $86,400 | $117,800 |
| 2017 | $5,023 | $204,200 | $86,400 | $117,800 |
| 2016 | $4,905 | $204,200 | $86,400 | $117,800 |
| 2015 | $5,569 | $271,000 | $114,500 | $156,500 |
| 2014 | $5,512 | $271,000 | $114,500 | $156,500 |
Source: Public Records
Map
Nearby Homes
- 4 W Cooper St
- 301 E McFarlan St -A and B
- 12 David St
- 12 Lincoln Ave
- 515 Herrick Dr
- 179 Pequannock St
- 19 Heritage Way
- 121 W Clinton St
- 13 James St
- 22 Faesch Ct
- 31 Independence Way
- 75 White St
- 77B Highland Way
- 142 W Blackwell St
- 67 Victory Ct Unit 67B
- 71 Washington Ave Unit 73
- 34 Hillsborough Ct Unit 34
- 414 Mineral Springs Dr
- 18 Elycroft Ave
- 121 W Munson Ave
- 297 E Mcfarlan St
- 165 Clark St
- 155 Clark St
- 153 Clark St
- 16 Jackson Ave
- 151 Clark St
- 1 Jackson Ave
- 1 Christopher St
- 301 E Mcfarlan St
- 123 Clark St
- 123 Clark St Unit B
- 18 Jackson Ave
- 136 Clark St Unit 140
- 142 Clark St Unit 146
- 3 Christopher St
- 132 Clark St
- 305 E Mcfarlan St
- 119 Clark St
- 5 Christopher St A B
- 128 Clark St
Your Personal Tour Guide
Ask me questions while you tour the home.