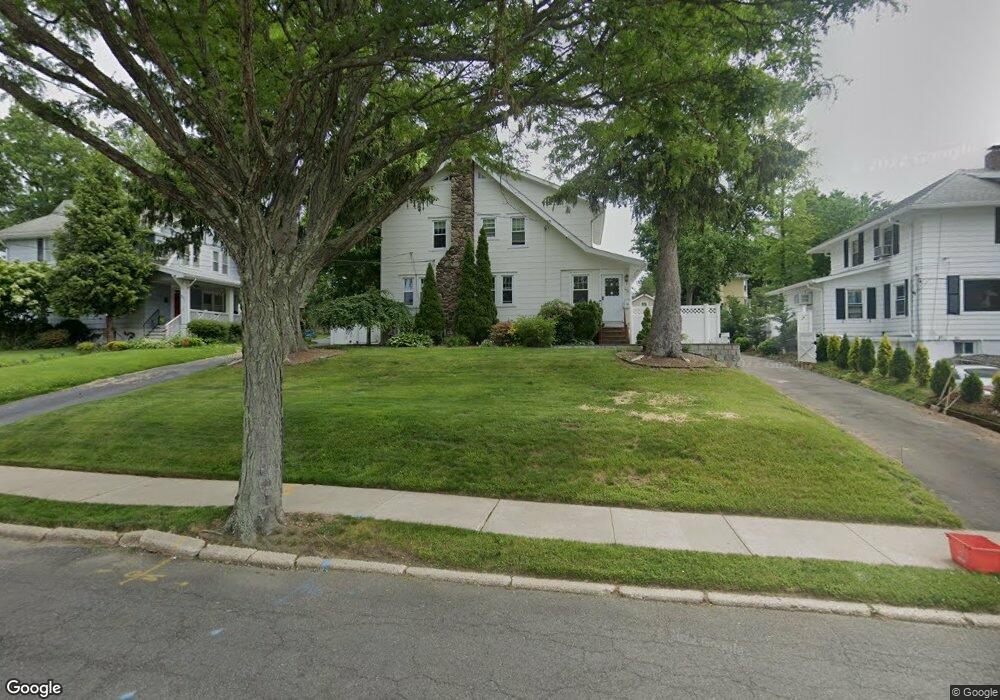
295 Glen Ave Port Chester, NY 10573
Estimated Value: $788,000 - $910,000
4
Beds
2
Baths
2,500
Sq Ft
$335/Sq Ft
Est. Value
About This Home
This home is located at 295 Glen Ave, Port Chester, NY 10573 and is currently estimated at $836,348, approximately $334 per square foot. 295 Glen Ave is a home located in Westchester County with nearby schools including Port Chester Middle School, Port Chester Senior High School, and Corpus Christi Holy Rosary School.
Ownership History
Date
Name
Owned For
Owner Type
Purchase Details
Closed on
Sep 8, 2010
Sold by
Pfuhler Edward and Pfuhler Janis
Bought by
Delakas Peter P and Redzanovic Delakis Alma
Current Estimated Value
Home Financials for this Owner
Home Financials are based on the most recent Mortgage that was taken out on this home.
Original Mortgage
$389,751
Outstanding Balance
$261,384
Interest Rate
4.75%
Mortgage Type
FHA
Estimated Equity
$574,964
Create a Home Valuation Report for This Property
The Home Valuation Report is an in-depth analysis detailing your home's value as well as a comparison with similar homes in the area
Home Values in the Area
Average Home Value in this Area
Purchase History
| Date | Buyer | Sale Price | Title Company |
|---|---|---|---|
| Delakas Peter P | $395,000 | None Available |
Source: Public Records
Mortgage History
| Date | Status | Borrower | Loan Amount |
|---|---|---|---|
| Open | Delakas Peter P | $389,751 |
Source: Public Records
Tax History Compared to Growth
Tax History
| Year | Tax Paid | Tax Assessment Tax Assessment Total Assessment is a certain percentage of the fair market value that is determined by local assessors to be the total taxable value of land and additions on the property. | Land | Improvement |
|---|---|---|---|---|
| 2024 | $12,060 | $600,600 | $283,700 | $316,900 |
| 2023 | $11,408 | $577,500 | $270,200 | $307,300 |
| 2022 | $10,492 | $550,000 | $270,200 | $279,800 |
| 2021 | $11,229 | $500,000 | $270,200 | $229,800 |
| 2020 | $11,506 | $500,000 | $270,200 | $229,800 |
| 2019 | $14,164 | $468,000 | $211,700 | $256,300 |
| 2018 | $7,931 | $461,300 | $202,500 | $258,800 |
| 2017 | $1,555 | $452,500 | $195,500 | $257,000 |
| 2016 | $9,141 | $393,900 | $215,700 | $178,200 |
| 2015 | -- | $371,000 | $195,300 | $175,700 |
| 2014 | -- | $382,500 | $189,500 | $193,000 |
| 2013 | -- | $382,100 | $185,300 | $196,800 |
Source: Public Records
Map
Nearby Homes