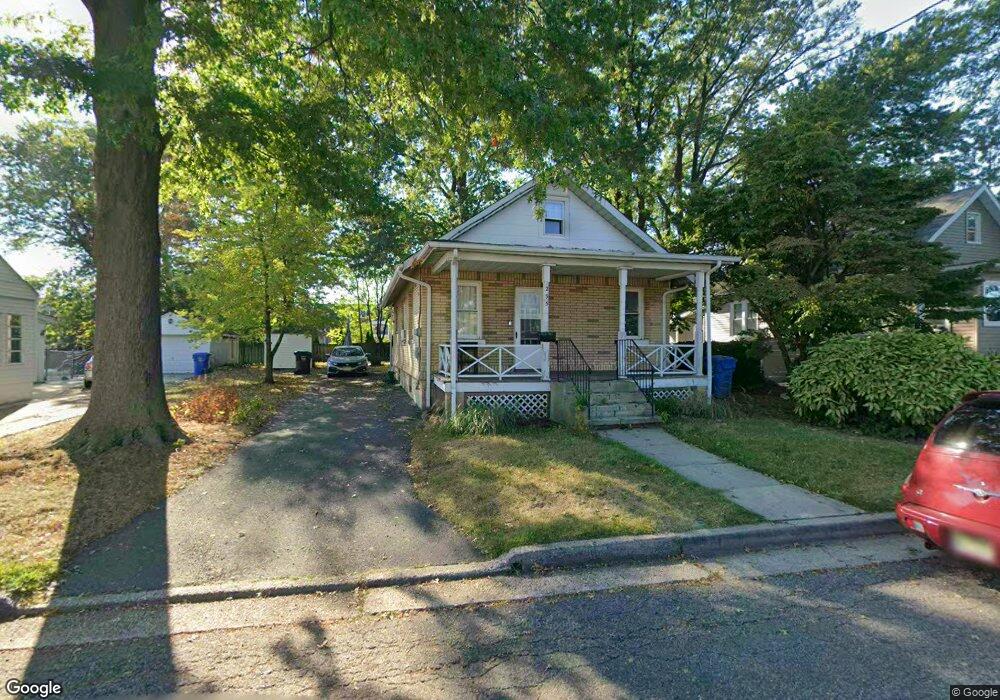
295 Grove St Woodbridge, NJ 07095
Estimated Value: $220,780 - $396,000
--
Bed
--
Bath
823
Sq Ft
$393/Sq Ft
Est. Value
About This Home
This home is located at 295 Grove St, Woodbridge, NJ 07095 and is currently estimated at $323,695, approximately $393 per square foot. 295 Grove St is a home located in Middlesex County with nearby schools including Ross Street Elementary School, Woodbridge Middle School, and Woodbridge High School.
Ownership History
Date
Name
Owned For
Owner Type
Purchase Details
Closed on
Jun 13, 2019
Sold by
Simon John and Simon Richard
Bought by
Estevez Kassandra
Current Estimated Value
Home Financials for this Owner
Home Financials are based on the most recent Mortgage that was taken out on this home.
Original Mortgage
$145,500
Outstanding Balance
$127,930
Interest Rate
4.1%
Mortgage Type
New Conventional
Estimated Equity
$195,765
Purchase Details
Closed on
Oct 25, 2016
Sold by
Friis Ron
Bought by
Tully Michael and Traschetti Samantha
Home Financials for this Owner
Home Financials are based on the most recent Mortgage that was taken out on this home.
Original Mortgage
$215,201
Interest Rate
3.25%
Mortgage Type
FHA
Purchase Details
Closed on
Jun 7, 2012
Sold by
Simon Rose
Bought by
Simon John and Simon Richard
Create a Home Valuation Report for This Property
The Home Valuation Report is an in-depth analysis detailing your home's value as well as a comparison with similar homes in the area
Home Values in the Area
Average Home Value in this Area
Purchase History
| Date | Buyer | Sale Price | Title Company |
|---|---|---|---|
| Estevez Kassandra | $150,000 | First Jersey Ttl Servicse In | |
| Tully Michael | $235,000 | East Coast Title Agency | |
| Simon John | -- | -- | |
| Simon John | -- | -- |
Source: Public Records
Mortgage History
| Date | Status | Borrower | Loan Amount |
|---|---|---|---|
| Open | Estevez Kassandra | $145,500 | |
| Previous Owner | Tully Michael | $215,201 |
Source: Public Records
Tax History Compared to Growth
Tax History
| Year | Tax Paid | Tax Assessment Tax Assessment Total Assessment is a certain percentage of the fair market value that is determined by local assessors to be the total taxable value of land and additions on the property. | Land | Improvement |
|---|---|---|---|---|
| 2025 | $6,186 | $45,700 | $18,800 | $26,900 |
| 2024 | $6,032 | $45,700 | $18,800 | $26,900 |
| 2023 | $6,032 | $45,700 | $18,800 | $26,900 |
| 2022 | $5,665 | $45,700 | $18,800 | $26,900 |
| 2021 | $5,606 | $45,700 | $18,800 | $26,900 |
| 2020 | $5,422 | $45,700 | $18,800 | $26,900 |
| 2019 | $5,284 | $45,700 | $18,800 | $26,900 |
| 2018 | $5,145 | $45,700 | $18,800 | $26,900 |
| 2017 | $5,042 | $45,700 | $18,800 | $26,900 |
| 2016 | $4,994 | $45,700 | $18,800 | $26,900 |
| 2015 | $4,895 | $45,700 | $18,800 | $26,900 |
| 2014 | $4,779 | $45,700 | $18,800 | $26,900 |
Source: Public Records
Map
Nearby Homes
- 355 Oak Ave
- 325 Regency Place Unit 325
- 341 Grady Dr
- 55 Metuchen Ave
- 2 Metuchen Ave
- 191 Sherry St
- 816 Sharon Garden Ct
- 702 Sharon Garden Ct
- 615 Sharon Garden Ct
- 401 Sharon Garden Ct Unit 401
- 340 Sharon Garden Ct
- 324 Sharon Garden Ct Unit 324
- 324 Sharon Ct
- 645 Cricket Ln
- 641 Cricket Ln
- 152 Bunns Ln
- 206 Sharon Garden Ct
- 1307 Cricket Ln
- 183 Strawberry Hill Ave
- 96 Wick Dr