Estimated Value: $325,053 - $787,000
--
Bed
--
Bath
756
Sq Ft
$607/Sq Ft
Est. Value
About This Home
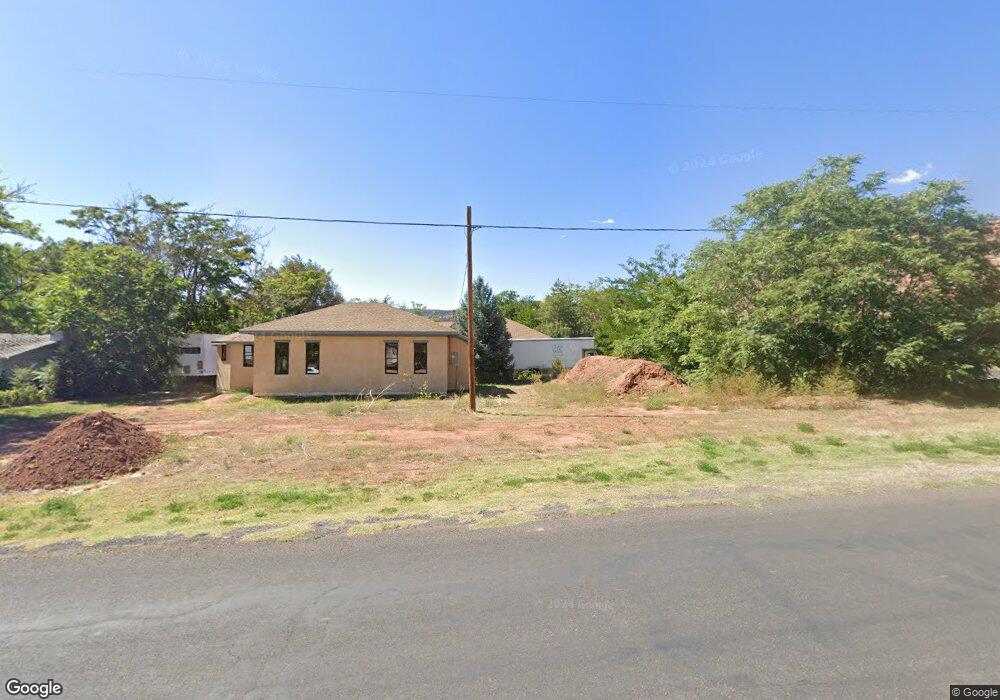
This home is located at 295 N Main St, Kanab, UT 84741 and is currently estimated at $459,263, approximately $607 per square foot. 295 N Main St is a home located in Kane County with nearby schools including Kanab Elementary School, Kanab Middle School, and Kanab High School.
Ownership History
Date
Name
Owned For
Owner Type
Purchase Details
Closed on
Apr 21, 2025
Bought by
Csenge Richard F and Csenge Debra L
Current Estimated Value
Purchase Details
Closed on
Jun 2, 2005
Sold by
Weitz Fern A
Bought by
Csenge Richard F and Csenge Debra L
Home Financials for this Owner
Home Financials are based on the most recent Mortgage that was taken out on this home.
Original Mortgage
$50,000
Interest Rate
5.74%
Create a Home Valuation Report for This Property
The Home Valuation Report is an in-depth analysis detailing your home's value as well as a comparison with similar homes in the area
Home Values in the Area
Average Home Value in this Area
Purchase History
| Date | Buyer | Sale Price | Title Company |
|---|---|---|---|
| Csenge Richard F | -- | -- | |
| Csenge Richard F | -- | -- |
Source: Public Records
Mortgage History
| Date | Status | Borrower | Loan Amount |
|---|---|---|---|
| Previous Owner | Csenge Richard F | $50,000 |
Source: Public Records
Tax History Compared to Growth
Tax History
| Year | Tax Paid | Tax Assessment Tax Assessment Total Assessment is a certain percentage of the fair market value that is determined by local assessors to be the total taxable value of land and additions on the property. | Land | Improvement |
|---|---|---|---|---|
| 2025 | $1,300 | $173,596 | $71,645 | $101,951 |
| 2024 | $1,300 | $151,060 | $59,211 | $91,849 |
| 2023 | $1,211 | $144,191 | $56,392 | $87,799 |
| 2022 | $1,045 | $123,195 | $43,378 | $79,817 |
| 2021 | $568 | $100,583 | $63,580 | $37,003 |
| 2020 | $542 | $93,047 | $57,800 | $35,247 |
| 2019 | $516 | $86,352 | $52,404 | $33,948 |
| 2018 | $468 | $77,618 | $43,670 | $33,948 |
| 2017 | $457 | $72,379 | $39,700 | $32,679 |
| 2016 | $434 | $66,760 | $39,700 | $27,060 |
| 2015 | $437 | $64,653 | $39,700 | $24,953 |
| 2014 | $437 | $66,821 | $41,888 | $24,933 |
| 2013 | -- | $36,751 | $0 | $0 |
Source: Public Records
Map
Nearby Homes
- 163 E 200 N
- 253 N 240 W Unit 4
- 197 N 200 W
- 163 N 200 W
- 0 200 Unit 1409069
- 0 250 E
- 75 N 200 W
- 65 & 75 200
- 233 E 100 N
- 300 E 300 N Unit L5
- 300 E 300 N Unit A8
- 143 E 100 S Unit 1
- 143 E 100 S Unit 2
- 0 W 100 S
- 300 N 300 E Unit L5
- 89 W 100 S
- 116 S 100 E
- 320 W Los Barancos Ln
- 190 W Ladera Ln
- 327 W Los Barancos Ln