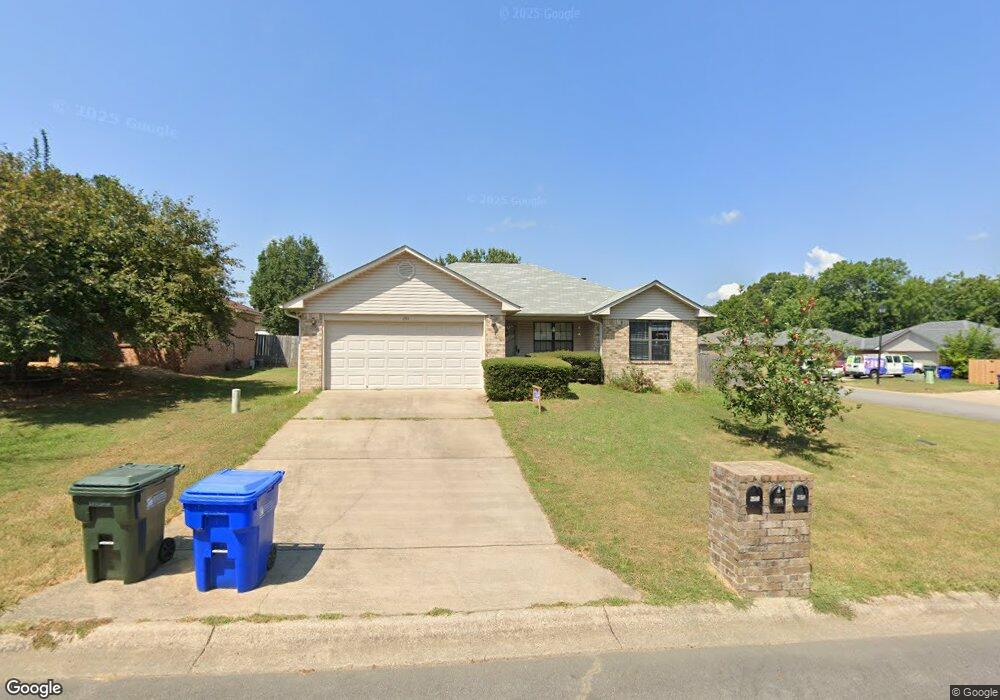
295 Niagra Falls Conway, AR 72032
East Conway NeighborhoodEstimated Value: $178,000 - $190,000
3
Beds
2
Baths
1,148
Sq Ft
$161/Sq Ft
Est. Value
About This Home
This home is located at 295 Niagra Falls, Conway, AR 72032 and is currently estimated at $184,553, approximately $160 per square foot. 295 Niagra Falls is a home located in Faulkner County with nearby schools including Preston & Florence Mattison Elementary School, Bob Courtway Middle School, and Conway Junior High School.
Ownership History
Date
Name
Owned For
Owner Type
Purchase Details
Closed on
Jun 1, 2023
Sold by
Swanson Steven
Bought by
Tribble Jordan Nichole
Current Estimated Value
Home Financials for this Owner
Home Financials are based on the most recent Mortgage that was taken out on this home.
Original Mortgage
$169,375
Outstanding Balance
$164,700
Interest Rate
6.43%
Mortgage Type
FHA
Estimated Equity
$19,853
Purchase Details
Closed on
Apr 29, 2016
Sold by
Owens Talisa Camille
Bought by
Swanson Steven
Home Financials for this Owner
Home Financials are based on the most recent Mortgage that was taken out on this home.
Original Mortgage
$108,007
Interest Rate
3.62%
Mortgage Type
FHA
Purchase Details
Closed on
Aug 6, 2010
Sold by
Turney George E and Turney Kimberly R
Bought by
Owens Talisa Camille
Home Financials for this Owner
Home Financials are based on the most recent Mortgage that was taken out on this home.
Original Mortgage
$107,257
Interest Rate
4.69%
Mortgage Type
VA
Purchase Details
Closed on
Sep 5, 2001
Bought by
Tri Con
Create a Home Valuation Report for This Property
The Home Valuation Report is an in-depth analysis detailing your home's value as well as a comparison with similar homes in the area
Home Values in the Area
Average Home Value in this Area
Purchase History
| Date | Buyer | Sale Price | Title Company |
|---|---|---|---|
| Tribble Jordan Nichole | $172,500 | Lenders Title Company | |
| Swanson Steven | $110,000 | Lenders Title Co | |
| Owens Talisa Camille | $105,000 | -- | |
| Tri Con | $49,300 | -- | |
| Tri Con | $166,700 | -- |
Source: Public Records
Mortgage History
| Date | Status | Borrower | Loan Amount |
|---|---|---|---|
| Open | Tribble Jordan Nichole | $169,375 | |
| Previous Owner | Swanson Steven | $108,007 | |
| Previous Owner | Owens Talisa Camille | $107,257 |
Source: Public Records
Tax History Compared to Growth
Tax History
| Year | Tax Paid | Tax Assessment Tax Assessment Total Assessment is a certain percentage of the fair market value that is determined by local assessors to be the total taxable value of land and additions on the property. | Land | Improvement |
|---|---|---|---|---|
| 2025 | $1,595 | $31,530 | $4,000 | $27,530 |
| 2024 | $1,595 | $31,530 | $4,000 | $27,530 |
| 2023 | $1,114 | $22,840 | $4,000 | $18,840 |
| 2022 | $691 | $22,840 | $4,000 | $18,840 |
| 2021 | $642 | $22,840 | $4,000 | $18,840 |
| 2020 | $593 | $19,140 | $4,000 | $15,140 |
| 2019 | $593 | $19,140 | $4,000 | $15,140 |
| 2018 | $618 | $19,140 | $4,000 | $15,140 |
| 2017 | $618 | $19,140 | $4,000 | $15,140 |
| 2016 | $618 | $19,140 | $4,000 | $15,140 |
| 2015 | $1,018 | $20,120 | $2,800 | $17,320 |
| 2014 | $668 | $20,120 | $2,800 | $17,320 |
Source: Public Records
Map
Nearby Homes
- 1550 Gold Falls
- 1510 Silver Falls
- 8 Bridgestone Dr
- 440 Bernard Dr
- 2.2 Acres Amity Rd
- 60 Sandpiper Ct
- 425 Cheyenne Ln
- 22 Southerland Rd
- 2100 Mary Alice Dr
- 24 Lots Hays Add
- 62 Addi Ln
- 82 Addi Ln
- 2485 E Oak St
- 30 Hazelwood Rd
- 2 Hopkins Ln
- 00 Caskay Dr
- 2510 E Oak St
- 2515 E Oak St
- 1012 Woodside Dr
- 00 Museum Rd
- 285 Niagra Falls
- 275 Niagra Falls
- 290 Niagra Falls
- 298 Niagra Falls
- 1540 Gold Falls
- 280 Niagra Falls
- 290 Great Falls
- 265 Niagra Falls
- 310 Niagra Falls Unit 320 Niagra Falls
- 280 Great Falls
- 0 Great Falls Unit 15030163
- 0 Great Falls Unit 16011221
- 0 Great Falls Unit 20026743
- 0 Great Falls Unit 17024227
- 0 Great Falls Unit 17036418
- 270 Niagra Falls
- 1530 Gold Falls
- 270 Great Falls
- 255 Niagra Falls
- 260 Niagra Falls