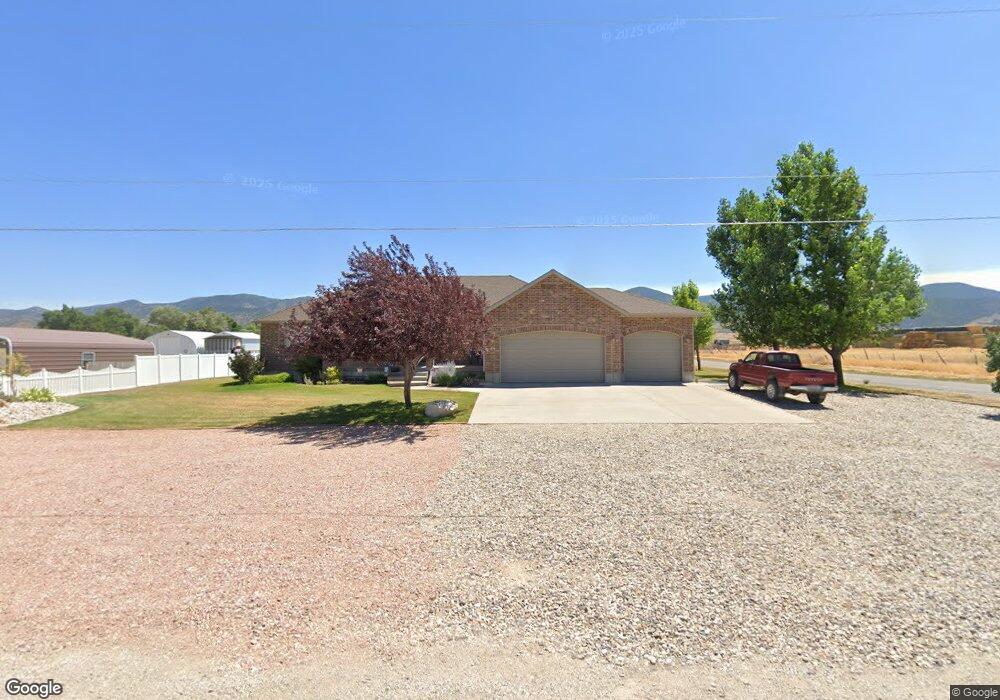
295 S 200 W Scipio, UT 84656
Estimated Value: $470,000
3
Beds
3
Baths
3,800
Sq Ft
$124/Sq Ft
Est. Value
About This Home
This home is located at 295 S 200 W, Scipio, UT 84656 and is currently estimated at $470,000, approximately $123 per square foot. 295 S 200 W is a home located in Millard County.
Ownership History
Date
Name
Owned For
Owner Type
Purchase Details
Closed on
Oct 5, 2021
Sold by
Case Michael G and Case Patricia S
Bought by
Eastman Randy L and Graham Lisa R
Current Estimated Value
Home Financials for this Owner
Home Financials are based on the most recent Mortgage that was taken out on this home.
Original Mortgage
$275,000
Outstanding Balance
$249,683
Interest Rate
2.8%
Mortgage Type
New Conventional
Estimated Equity
$220,317
Purchase Details
Closed on
Dec 17, 2014
Sold by
Tyler Tyler and Monroe Kimberly
Bought by
Case Michael G and Case Patricia S
Purchase Details
Closed on
Mar 17, 2006
Sold by
Monroe Tyler
Bought by
Monroe Tyler and Monroe Kimberly
Purchase Details
Closed on
Mar 16, 2006
Sold by
Zupan George C and Paramore Linda Z
Bought by
Monroe Tyler
Create a Home Valuation Report for This Property
The Home Valuation Report is an in-depth analysis detailing your home's value as well as a comparison with similar homes in the area
Home Values in the Area
Average Home Value in this Area
Purchase History
| Date | Buyer | Sale Price | Title Company |
|---|---|---|---|
| Eastman Randy L | -- | First American Title Insuran | |
| Case Michael G | -- | Eagle Gate Title | |
| Monroe Tyler | -- | -- | |
| Monroe Tyler | -- | -- |
Source: Public Records
Mortgage History
| Date | Status | Borrower | Loan Amount |
|---|---|---|---|
| Open | Eastman Randy L | $275,000 |
Source: Public Records
Tax History Compared to Growth
Tax History
| Year | Tax Paid | Tax Assessment Tax Assessment Total Assessment is a certain percentage of the fair market value that is determined by local assessors to be the total taxable value of land and additions on the property. | Land | Improvement |
|---|---|---|---|---|
| 2025 | $2,092 | $266,877 | $24,606 | $242,271 |
| 2024 | $2,092 | $238,931 | $18,700 | $220,231 |
| 2023 | $2,294 | $238,931 | $18,700 | $220,231 |
| 2022 | $1,730 | $158,743 | $18,700 | $140,043 |
| 2021 | $1,536 | $135,181 | $13,852 | $121,329 |
| 2020 | $1,428 | $126,579 | $12,045 | $114,534 |
| 2019 | $1,291 | $114,932 | $12,045 | $102,887 |
| 2018 | $1,198 | $109,108 | $12,045 | $97,063 |
| 2017 | $1,253 | $109,108 | $12,045 | $97,063 |
| 2016 | $1,158 | $104,887 | $10,389 | $94,498 |
| 2015 | $1,159 | $104,887 | $10,389 | $94,498 |
| 2014 | -- | $103,532 | $9,034 | $94,498 |
| 2013 | -- | $103,532 | $9,034 | $94,498 |
Source: Public Records
Map
Nearby Homes
- 7 N 200 W
- 85 E 200 Rd N
- 2000 N 500 W
- 9155 Red Canyon Rd Unit 15
- 13051 Red Canyon Rd Unit 3
- 9160 Red Canyon Rd Unit 5
- 700 W 1100 S
- 8300 N 3300 E
- Mecham Rd
- 290 N 200 Rd E
- 445 S Main St
- 66 W 100 S
- 26 N Mount Baldy Estates Rd Unit 26
- 117 E 300 S
- 36 W 100 S
- 155 S 200 W
- 420 W 350 N
- 80 N 400 W
- 165 E Center
- 340 E 300 S
- 0 All Lot 1 Blk 5 Plat A Unit A 95001
- 0 All Lot 1 Blk 5 Plat A Unit 21-224938
- 0 S1 2 Lot 4 Block 5 Platt A Unit 95002
- 0 S1 2 Lot 4 Block 5 Platt A Unit 21-224939
- 200 S S 200 West St St W
- 235 S 300 W
- 200 S S 200 West St St W
- 100 S S 100 West St St W
- 65 W 200 S
- 90 S 100 W
- 100 S S 100 West St St W
- 325 S 340 W
- 130 S 200 W
- 286 S State St
- 7900 S 340 Rd W
- 230 S State St
- 110 S 100 Rd W
- 100 S S 100 West St St W
- 180 S State St
- 170 S State