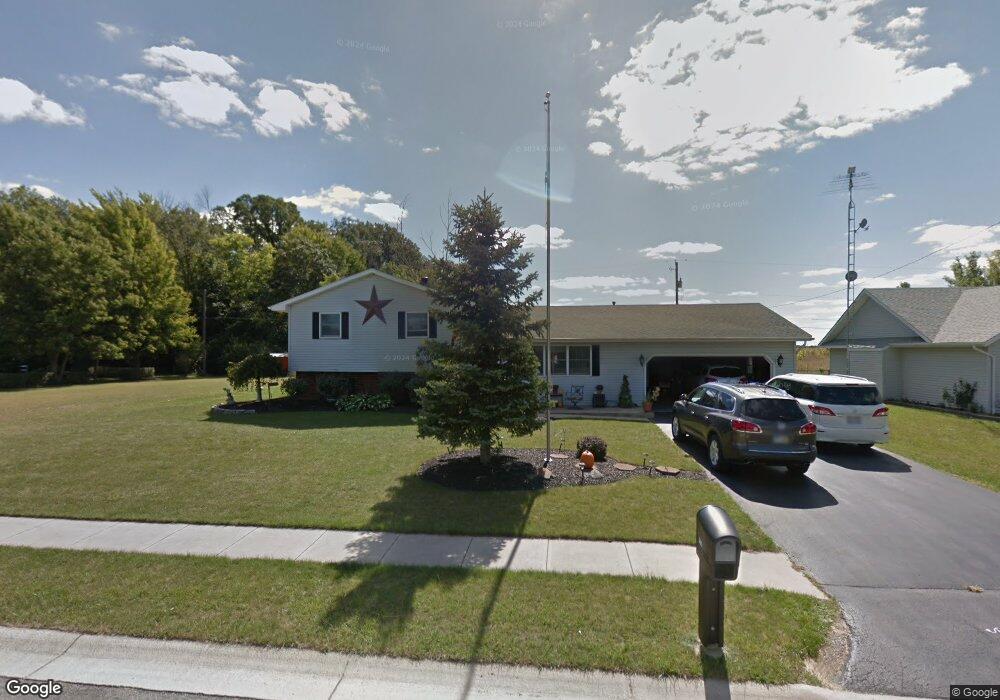
295 Southcrest Dr Mc Comb, OH 45858
McComb NeighborhoodEstimated Value: $217,000 - $297,000
4
Beds
2
Baths
2,044
Sq Ft
$125/Sq Ft
Est. Value
About This Home
This home is located at 295 Southcrest Dr, Mc Comb, OH 45858 and is currently estimated at $254,903, approximately $124 per square foot. 295 Southcrest Dr is a home located in Hancock County with nearby schools including McComb Elementary School, McComb Middle School, and Mccomb Local High School.
Ownership History
Date
Name
Owned For
Owner Type
Purchase Details
Closed on
Apr 18, 2025
Sold by
Wasson Joseph F and Wasson Rebecca S
Bought by
Joseph F Wasson Revocable Trust and Rebecca S Wasson Revocable Trust
Current Estimated Value
Purchase Details
Closed on
Nov 23, 1998
Sold by
Ray Ronnie
Bought by
Nowlin John and Nowlin Melissa
Home Financials for this Owner
Home Financials are based on the most recent Mortgage that was taken out on this home.
Original Mortgage
$100,000
Interest Rate
6.59%
Mortgage Type
New Conventional
Purchase Details
Closed on
Dec 15, 1993
Bought by
Ray Ronnie L and Ray Vickie L
Purchase Details
Closed on
Apr 14, 1989
Bought by
Leonard James A and Leonard Donna M
Purchase Details
Closed on
Jun 14, 1985
Bought by
Michaelis Michael C
Create a Home Valuation Report for This Property
The Home Valuation Report is an in-depth analysis detailing your home's value as well as a comparison with similar homes in the area
Home Values in the Area
Average Home Value in this Area
Purchase History
| Date | Buyer | Sale Price | Title Company |
|---|---|---|---|
| Joseph F Wasson Revocable Trust | -- | None Listed On Document | |
| Nowlin John | $127,000 | -- | |
| Ray Ronnie L | $100,000 | -- | |
| Leonard James A | $74,900 | -- | |
| Michaelis Michael C | $6,500 | -- |
Source: Public Records
Mortgage History
| Date | Status | Borrower | Loan Amount |
|---|---|---|---|
| Previous Owner | Nowlin John | $100,000 |
Source: Public Records
Tax History Compared to Growth
Tax History
| Year | Tax Paid | Tax Assessment Tax Assessment Total Assessment is a certain percentage of the fair market value that is determined by local assessors to be the total taxable value of land and additions on the property. | Land | Improvement |
|---|---|---|---|---|
| 2024 | $2,159 | $63,570 | $7,950 | $55,620 |
| 2023 | $2,145 | $63,570 | $7,950 | $55,620 |
| 2022 | $2,551 | $63,570 | $7,950 | $55,620 |
| 2021 | $2,428 | $54,550 | $6,120 | $48,430 |
| 2020 | $2,124 | $54,550 | $6,120 | $48,430 |
| 2019 | $2,326 | $54,550 | $6,120 | $48,430 |
| 2018 | $1,933 | $47,430 | $5,320 | $42,110 |
| 2017 | $972 | $47,430 | $5,320 | $42,110 |
| 2016 | $1,781 | $47,430 | $5,320 | $42,110 |
| 2015 | $1,533 | $39,480 | $7,450 | $32,030 |
| 2014 | $1,538 | $39,270 | $7,450 | $31,820 |
| 2012 | $1,918 | $46,460 | $7,450 | $39,010 |
Source: Public Records
Map
Nearby Homes
- 0 Joshua Rd Unit 6126475
- 102 Meadowshire Dr
- 223 N Church St
- 223 Cherry St
- 5330 State Route 186
- 3699 State Route 613
- 3019 Ohio 235
- 4134 County Road 203
- 687 State Route 235
- 8922 Township Road 94
- 358 State Route 613
- 7780 Township Road 89
- 0 Rock Candy Rd Unit Lot 159
- 0 Rock Candy Rd Unit Lot 170
- 0 Rock Candy Rd Unit Lot 172 206819
- 0 Rock Candy Rd Unit Lot 162
- 0 Rock Candy Rd Unit Lot 171
- 0 Rock Candy Rd Unit Lot 168
- 0 Rock Candy Rd Or Bushwillow Dr Unit Lot 173
- 0 Bearcat Way Or Rock Candy Rd Unit Lot 167
- 291 Southcrest Dr
- 0 Southcrest Dr Unit H119469
- 0 Southcrest Dr Unit H123934
- 287 Southcrest Dr
- 304 Southcrest Dr
- 304 Southcrest Dr
- 308 Southcrest Dr
- 311 Southcrest Dr
- 292 Southcrest Dr
- 283 Southcrest Dr
- 312 Southcrest Dr
- 101 Christy Ct
- 315 Southcrest Dr
- 316 Southcrest Dr
- 105 Christy Ct
- 279 Southcrest Dr
- 319 Southcrest Dr
- 316 Park Dr N
- 318 Southcrest Dr
- 109 Christy Ct