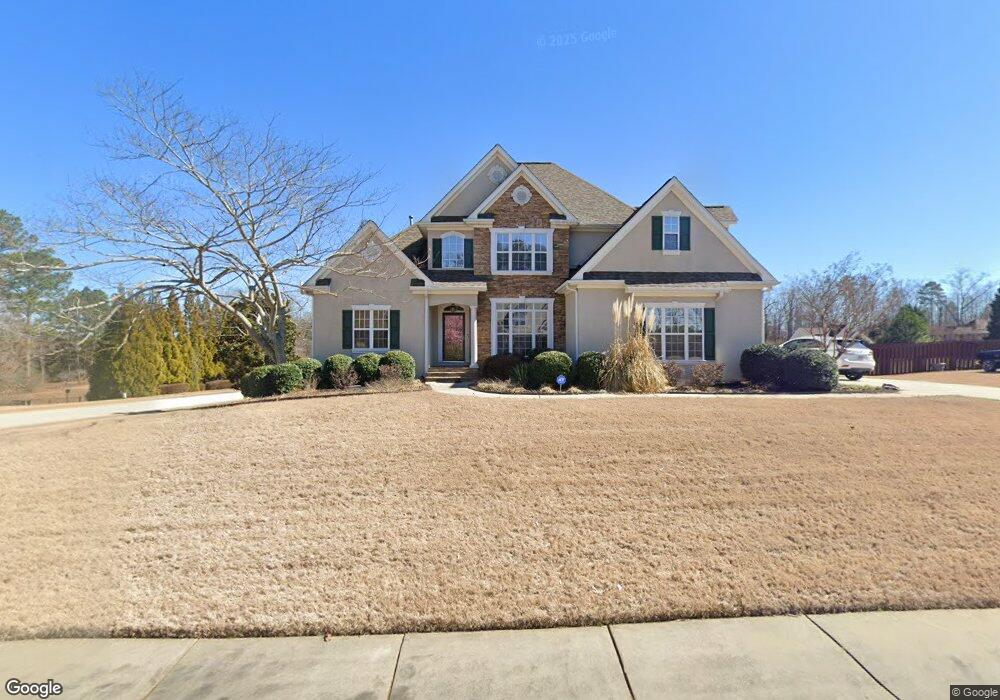
295 Sunderland Cir Unit 46 Fayetteville, GA 30215
Estimated Value: $550,000 - $628,000
6
Beds
4
Baths
3,538
Sq Ft
$170/Sq Ft
Est. Value
About This Home
This home is located at 295 Sunderland Cir Unit 46, Fayetteville, GA 30215 and is currently estimated at $600,981, approximately $169 per square foot. 295 Sunderland Cir Unit 46 is a home located in Fayette County with nearby schools including Cleveland Elementary School, Bennett's Mill Middle School, and Fayette County High School.
Ownership History
Date
Name
Owned For
Owner Type
Purchase Details
Closed on
Jul 22, 2024
Sold by
Carter Lavonna and Carter Ruby L
Bought by
Lavonna L Carter Revocable Living Trust and Carter
Current Estimated Value
Purchase Details
Closed on
Jul 7, 2022
Sold by
Carter Ruby L
Bought by
Carter Ruby L and Carter Lavonna
Purchase Details
Closed on
Apr 10, 2015
Sold by
Noble Cheryl A
Bought by
Dolan Timothy J and Dolan Susan L
Home Financials for this Owner
Home Financials are based on the most recent Mortgage that was taken out on this home.
Original Mortgage
$165,000
Interest Rate
3.95%
Mortgage Type
New Conventional
Purchase Details
Closed on
Jun 30, 2003
Sold by
Chris Dixon/Assoc Inc
Bought by
Noble Cheryl A
Home Financials for this Owner
Home Financials are based on the most recent Mortgage that was taken out on this home.
Original Mortgage
$164,900
Interest Rate
5.3%
Mortgage Type
New Conventional
Create a Home Valuation Report for This Property
The Home Valuation Report is an in-depth analysis detailing your home's value as well as a comparison with similar homes in the area
Home Values in the Area
Average Home Value in this Area
Purchase History
| Date | Buyer | Sale Price | Title Company |
|---|---|---|---|
| Lavonna L Carter Revocable Living Trust | -- | None Listed On Document | |
| Lavonna L Carter Revocable Living Trust | -- | None Listed On Document | |
| Carter Ruby L | -- | None Listed On Document | |
| Carter Ruby L | $599,900 | None Listed On Document | |
| Dolan Timothy J | $265,000 | -- | |
| Noble Cheryl A | $274,900 | -- |
Source: Public Records
Mortgage History
| Date | Status | Borrower | Loan Amount |
|---|---|---|---|
| Previous Owner | Dolan Timothy J | $165,000 | |
| Previous Owner | Noble Cheryl A | $164,900 |
Source: Public Records
Tax History Compared to Growth
Tax History
| Year | Tax Paid | Tax Assessment Tax Assessment Total Assessment is a certain percentage of the fair market value that is determined by local assessors to be the total taxable value of land and additions on the property. | Land | Improvement |
|---|---|---|---|---|
| 2024 | $2,282 | $227,748 | $32,000 | $195,748 |
| 2023 | $6,870 | $225,680 | $32,000 | $193,680 |
| 2022 | $4,636 | $182,400 | $22,000 | $160,400 |
| 2021 | $4,169 | $142,880 | $22,000 | $120,880 |
| 2020 | $4,229 | $138,800 | $22,000 | $116,800 |
| 2019 | $4,089 | $133,000 | $22,000 | $111,000 |
| 2018 | $3,952 | $127,280 | $17,600 | $109,680 |
| 2017 | $3,875 | $131,760 | $17,600 | $114,160 |
| 2016 | $3,171 | $105,976 | $15,416 | $90,560 |
| 2015 | $1,879 | $93,600 | $17,600 | $76,000 |
| 2014 | $1,715 | $83,680 | $17,600 | $66,080 |
| 2013 | -- | $82,960 | $0 | $0 |
Source: Public Records
Map
Nearby Homes
- 180 Sunderland Cir
- 335 Grand Teton Cir
- 490 Grand Teton Cir
- 470 Grand Teton Cir
- 262 Otter Cir
- 360 Grand Teton Cir
- 120 Godby Dr
- 322 Hambrick Park
- 215 Wallace St
- 155 Mine Run
- 125 Nina Celeste Ln
- 0 S Sandy Creek Rd Unit 10588191
- 135 Waterlace Way
- 165 Blackjack Ct
- 175 Ferncliff
- 140 Ridgecrest Dr Unit 2
- 227 Blue Point Pkwy
- 130 Edgewater Trail
- 155 Cottage Cir
- 140 Rockglen Ct
- 295 Sunderland Cir
- 305 Sunderland Cir
- 235 Sunderland Cir
- 270 Sunderland Cir
- 300 Sunderland Cir
- 225 Sunderland Cir
- 225 Sunderland Cir Unit 44
- 310 Sunderland Cir Unit 21
- 310 Sunderland Cir
- 280 Sunderland Cir
- 315 Sunderland Cir
- 290 Sunderland Cir
- 215 Sunderland Cir
- 320 Sunder Circle
- 320 Sunderland Cir Unit 22
- 320 Sunderland Cir
- 230 Sunderland Cir
- 250 Sunderland Cir
- 240 Sunderland Cir
- 230 Brock Ct Unit 35