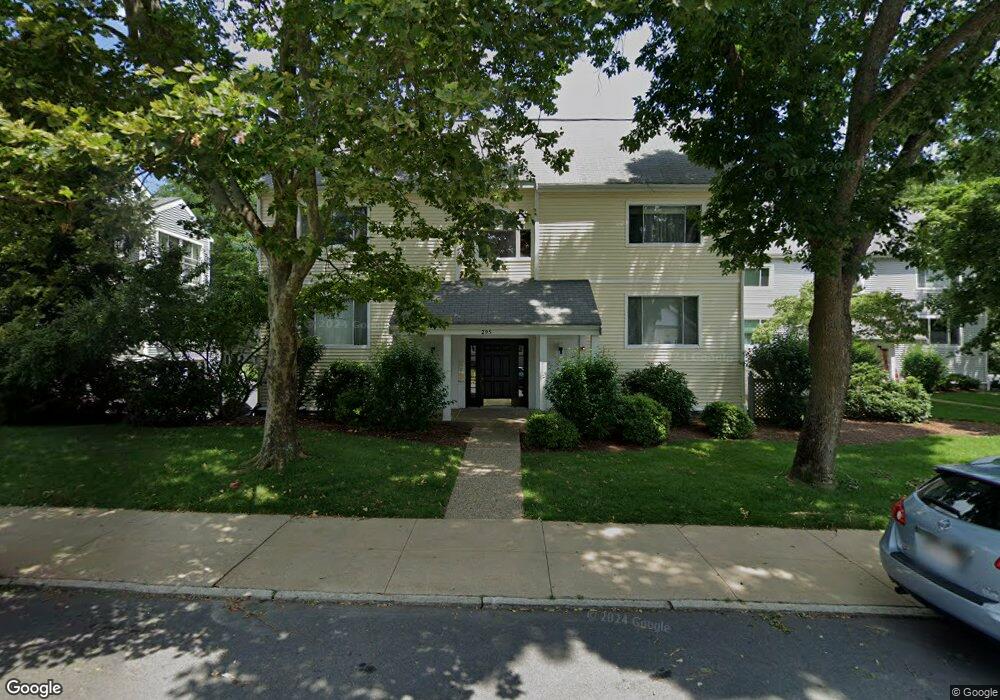
295 Temple St Unit 30 West Roxbury, MA 02132
West Roxbury NeighborhoodEstimated Value: $533,000 - $543,000
2
Beds
1
Bath
870
Sq Ft
$618/Sq Ft
Est. Value
About This Home
This home is located at 295 Temple St Unit 30, West Roxbury, MA 02132 and is currently estimated at $537,718, approximately $618 per square foot. 295 Temple St Unit 30 is a home located in Suffolk County with nearby schools including St Theresa School, Catholic Memorial School, and The Roxbury Latin School.
Ownership History
Date
Name
Owned For
Owner Type
Purchase Details
Closed on
Jun 26, 2012
Sold by
Obrien Patricia A
Bought by
Reznikov Irene
Current Estimated Value
Home Financials for this Owner
Home Financials are based on the most recent Mortgage that was taken out on this home.
Original Mortgage
$238,729
Outstanding Balance
$166,111
Interest Rate
3.84%
Mortgage Type
New Conventional
Estimated Equity
$371,607
Purchase Details
Closed on
Aug 2, 2000
Sold by
Khan Zahra Z and Qureshi Nazer H
Bought by
Obrien Patricia A
Home Financials for this Owner
Home Financials are based on the most recent Mortgage that was taken out on this home.
Original Mortgage
$156,000
Interest Rate
8.1%
Mortgage Type
Purchase Money Mortgage
Purchase Details
Closed on
Dec 17, 1996
Sold by
Michalowski Mark C and Michalowski Nancy E
Bought by
Khan Zahra Z and Qureshi Nazer M
Create a Home Valuation Report for This Property
The Home Valuation Report is an in-depth analysis detailing your home's value as well as a comparison with similar homes in the area
Home Values in the Area
Average Home Value in this Area
Purchase History
| Date | Buyer | Sale Price | Title Company |
|---|---|---|---|
| Reznikov Irene | $261,000 | -- | |
| Obrien Patricia A | $195,000 | -- | |
| Khan Zahra Z | $129,000 | -- |
Source: Public Records
Mortgage History
| Date | Status | Borrower | Loan Amount |
|---|---|---|---|
| Open | Reznikov Irene | $238,729 | |
| Previous Owner | Khan Zahra Z | $175,300 | |
| Previous Owner | Khan Zahra Z | $156,000 |
Source: Public Records
Tax History Compared to Growth
Tax History
| Year | Tax Paid | Tax Assessment Tax Assessment Total Assessment is a certain percentage of the fair market value that is determined by local assessors to be the total taxable value of land and additions on the property. | Land | Improvement |
|---|---|---|---|---|
| 2025 | $5,416 | $467,700 | $0 | $467,700 |
| 2024 | $4,757 | $436,400 | $0 | $436,400 |
| 2023 | $4,548 | $423,500 | $0 | $423,500 |
| 2022 | $4,389 | $403,400 | $0 | $403,400 |
| 2021 | $4,304 | $403,400 | $0 | $403,400 |
| 2020 | $3,530 | $334,300 | $0 | $334,300 |
| 2019 | $3,294 | $312,500 | $0 | $312,500 |
| 2018 | $3,147 | $300,300 | $0 | $300,300 |
| 2017 | $3,057 | $288,700 | $0 | $288,700 |
| 2016 | $2,968 | $269,800 | $0 | $269,800 |
| 2015 | $3,302 | $272,700 | $0 | $272,700 |
| 2014 | $3,148 | $250,200 | $0 | $250,200 |
Source: Public Records
Map
Nearby Homes
- 331 Vermont St
- 9 Carroll St
- 105 Chesbrough Rd
- 577 Baker St Unit 577
- 183 Temple St
- 59 Chesbrough Rd
- 28 Dow Rd
- 89 Dwinell St
- 340 Baker St Unit 1
- 76 Vermont St
- 579 Baker St Unit 579
- 539 Lagrange St
- 73 Dent St Unit 1
- 76 Potomac St
- 845 Lagrange St Unit 4
- 865 Lagrange St Unit 5
- 1216 Vfw Pkwy Unit 40
- 1214 Vfw Pkwy Unit 30
- 1214 Vfw Pkwy Unit 37
- 14 Sanborn Ave
- 295 Temple St Unit 29
- 295 Temple St Unit 28
- 295 Temple St Unit 27
- 295 Temple St Unit 26
- 295 Temple St Unit 25
- 295 Temple St Unit 302
- 295 Temple St Unit 102
- 295 Temple St Unit 101
- 295 Temple St Unit 202
- 295 Temple St Unit 202,295
- 295 Temple St Unit 26/102
- 293 Temple St Unit 102
- 293 Temple St Unit 302
- 293 Temple St Unit 14
- 293 Temple St Unit 13
- 293 Temple St Unit 12
- 293 Temple St Unit 11
- 293 Temple St Unit 10
- 293 Temple St Unit 9
- 293 Temple St Unit 301,1