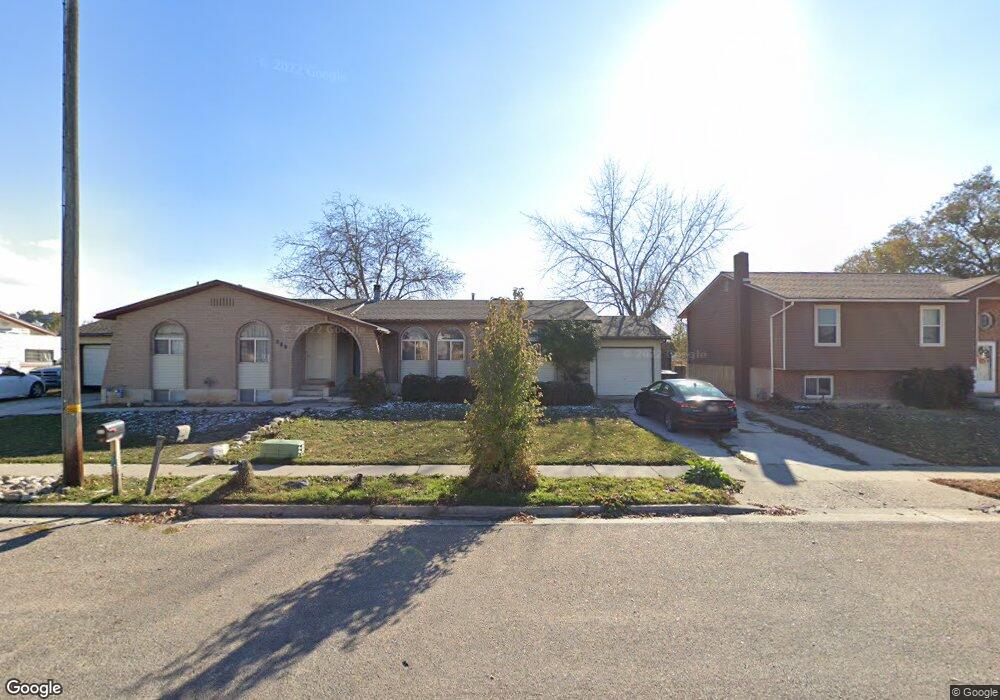
295 W 2400 S Clearfield, UT 84015
Estimated Value: $344,000 - $369,951
4
Beds
2
Baths
1,800
Sq Ft
$199/Sq Ft
Est. Value
About This Home
This home is located at 295 W 2400 S, Clearfield, UT 84015 and is currently estimated at $357,988, approximately $198 per square foot. 295 W 2400 S is a home located in Davis County with nearby schools including Antelope Elementary School, North Davis Junior High School, and Clearfield High School.
Ownership History
Date
Name
Owned For
Owner Type
Purchase Details
Closed on
Sep 13, 2018
Sold by
Bolles Kristi
Bought by
Hall Catherine
Current Estimated Value
Home Financials for this Owner
Home Financials are based on the most recent Mortgage that was taken out on this home.
Original Mortgage
$196,377
Outstanding Balance
$172,155
Interest Rate
4.94%
Mortgage Type
FHA
Estimated Equity
$185,833
Purchase Details
Closed on
Jan 22, 2009
Sold by
Harker Gary N and Harker Erely
Bought by
Josephson Raymond
Purchase Details
Closed on
Jun 29, 2005
Sold by
Pearson Deborah
Bought by
Bollesa Kristi
Home Financials for this Owner
Home Financials are based on the most recent Mortgage that was taken out on this home.
Original Mortgage
$21,900
Interest Rate
5.58%
Mortgage Type
Stand Alone Second
Create a Home Valuation Report for This Property
The Home Valuation Report is an in-depth analysis detailing your home's value as well as a comparison with similar homes in the area
Home Values in the Area
Average Home Value in this Area
Purchase History
| Date | Buyer | Sale Price | Title Company |
|---|---|---|---|
| Hall Catherine | -- | Backman Title Ser | |
| Josephson Raymond | -- | Bonneville Superior Tit | |
| Bollesa Kristi | -- | Equity Title Ins Agency Inc |
Source: Public Records
Mortgage History
| Date | Status | Borrower | Loan Amount |
|---|---|---|---|
| Open | Hall Catherine | $196,377 | |
| Previous Owner | Bollesa Kristi | $21,900 | |
| Previous Owner | Bollesa Kristi | $87,600 |
Source: Public Records
Tax History Compared to Growth
Tax History
| Year | Tax Paid | Tax Assessment Tax Assessment Total Assessment is a certain percentage of the fair market value that is determined by local assessors to be the total taxable value of land and additions on the property. | Land | Improvement |
|---|---|---|---|---|
| 2025 | $2,062 | $184,800 | $60,292 | $124,508 |
| 2024 | $2,011 | $181,500 | $57,720 | $123,780 |
| 2023 | $1,889 | $313,000 | $93,470 | $219,530 |
| 2022 | $1,878 | $168,300 | $54,704 | $113,596 |
| 2021 | $1,750 | $237,000 | $52,553 | $184,447 |
| 2020 | $1,606 | $216,000 | $43,235 | $172,765 |
| 2019 | $1,484 | $197,000 | $25,000 | $172,000 |
| 2018 | $1,268 | $164,000 | $25,000 | $139,000 |
| 2016 | $960 | $64,900 | $13,750 | $51,150 |
| 2015 | $960 | $61,875 | $13,750 | $48,125 |
| 2014 | $754 | $49,265 | $16,993 | $32,272 |
| 2013 | -- | $57,100 | $23,653 | $33,447 |
Source: Public Records
Map
Nearby Homes