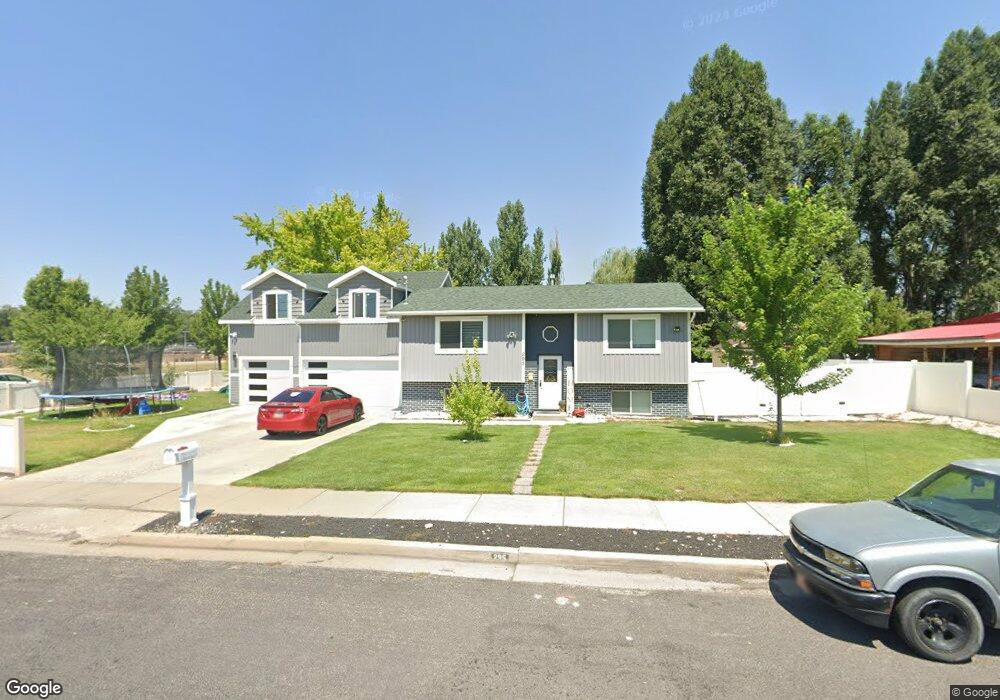
295 W 600 S Logan, UT 84321
Woodruff NeighborhoodEstimated Value: $361,000 - $413,655
Studio
--
Bath
929
Sq Ft
$422/Sq Ft
Est. Value
About This Home
This home is located at 295 W 600 S, Logan, UT 84321 and is currently estimated at $391,914, approximately $421 per square foot. 295 W 600 S is a home with nearby schools including Hillcrest Elementary School, Mount Logan Middle School, and Logan High School.
Ownership History
Date
Name
Owned For
Owner Type
Purchase Details
Closed on
Sep 18, 2012
Sold by
Lemus Carlos Omar and Lemus Sandra E
Bought by
Marroquin Jorge U
Current Estimated Value
Home Financials for this Owner
Home Financials are based on the most recent Mortgage that was taken out on this home.
Original Mortgage
$100,000
Outstanding Balance
$15,927
Interest Rate
3.55%
Mortgage Type
New Conventional
Estimated Equity
$375,987
Purchase Details
Closed on
Sep 26, 2001
Sold by
Seamons Sherwin K and Seamons Jane C
Bought by
Lemus Carlos Omar and Lemus Sandra E
Home Financials for this Owner
Home Financials are based on the most recent Mortgage that was taken out on this home.
Original Mortgage
$98,607
Interest Rate
6.91%
Mortgage Type
FHA
Create a Home Valuation Report for This Property
The Home Valuation Report is an in-depth analysis detailing your home's value as well as a comparison with similar homes in the area
Home Values in the Area
Average Home Value in this Area
Purchase History
| Date | Buyer | Sale Price | Title Company |
|---|---|---|---|
| Marroquin Jorge U | -- | Backman Ntp | |
| Lemus Carlos Omar | -- | American Secure Title |
Source: Public Records
Mortgage History
| Date | Status | Borrower | Loan Amount |
|---|---|---|---|
| Open | Marroquin Jorge U | $100,000 | |
| Previous Owner | Lemus Carlos Omar | $98,607 | |
| Closed | Lemus Carlos Omar | $3,650 |
Source: Public Records
Tax History
| Year | Tax Paid | Tax Assessment Tax Assessment Total Assessment is a certain percentage of the fair market value that is determined by local assessors to be the total taxable value of land and additions on the property. | Land | Improvement |
|---|---|---|---|---|
| 2025 | $1,942 | $251,215 | $0 | $0 |
| 2024 | $1,892 | $237,055 | $0 | $0 |
| 2023 | $1,622 | $193,675 | $0 | $0 |
| 2022 | $1,737 | $193,675 | $0 | $0 |
| 2021 | $1,693 | $291,710 | $50,000 | $241,710 |
| 2020 | $1,180 | $182,952 | $50,000 | $132,952 |
| 2019 | $1,233 | $182,951 | $50,000 | $132,951 |
| 2018 | $1,149 | $155,610 | $40,000 | $115,610 |
| 2017 | $1,115 | $79,805 | $0 | $0 |
| 2016 | $1,156 | $79,805 | $0 | $0 |
| 2015 | $997 | $68,765 | $0 | $0 |
| 2014 | $901 | $68,765 | $0 | $0 |
| 2013 | -- | $69,040 | $0 | $0 |
Source: Public Records
Map
Nearby Homes
Your Personal Tour Guide
Ask me questions while you tour the home.