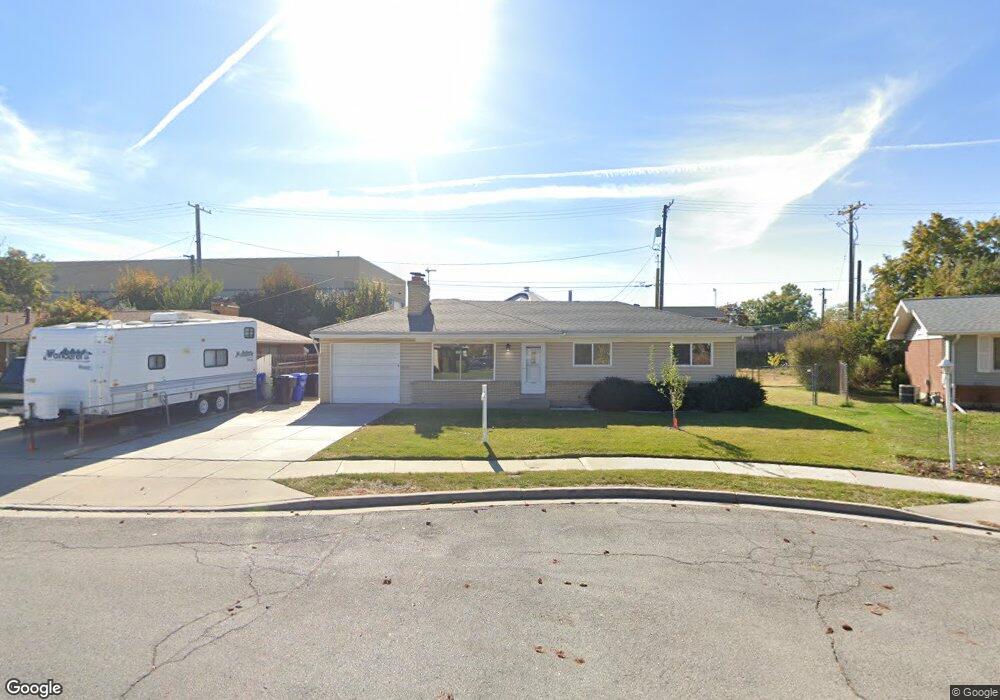
295 W 800 S Bountiful, UT 84010
Estimated Value: $470,000 - $518,031
6
Beds
2
Baths
2,200
Sq Ft
$224/Sq Ft
Est. Value
About This Home
This home is located at 295 W 800 S, Bountiful, UT 84010 and is currently estimated at $492,508, approximately $223 per square foot. 295 W 800 S is a home located in Davis County with nearby schools including Bountiful Elementary School, Millcreek Junior High School, and Bountiful High School.
Ownership History
Date
Name
Owned For
Owner Type
Purchase Details
Closed on
Dec 30, 2022
Sold by
Opendoor Property Trust
Bought by
Maxwell Amber Ann and Mccartney Maxwell Shaunon
Current Estimated Value
Home Financials for this Owner
Home Financials are based on the most recent Mortgage that was taken out on this home.
Original Mortgage
$429,084
Outstanding Balance
$415,385
Interest Rate
6.61%
Mortgage Type
FHA
Estimated Equity
$77,123
Purchase Details
Closed on
May 31, 2022
Sold by
Jennifer Smith
Bought by
Opendoor Property Trust
Purchase Details
Closed on
Apr 27, 2010
Sold by
Warhurst Norma K and The Warhurst Family Trust
Bought by
Smith Jennifer and Durkee Brian
Home Financials for this Owner
Home Financials are based on the most recent Mortgage that was taken out on this home.
Original Mortgage
$389,149
Interest Rate
2.8%
Mortgage Type
VA
Create a Home Valuation Report for This Property
The Home Valuation Report is an in-depth analysis detailing your home's value as well as a comparison with similar homes in the area
Purchase History
| Date | Buyer | Sale Price | Title Company |
|---|---|---|---|
| Maxwell Amber Ann | -- | Cottonwood Title | |
| Opendoor Property Trust | -- | Cottonwood Title | |
| Opendoor Property Trust | -- | Cottonwood Title | |
| Smith Jennifer | -- | Cottonwood Title In | |
| Warhurst Norma K | -- | None Available |
Source: Public Records
Mortgage History
| Date | Status | Borrower | Loan Amount |
|---|---|---|---|
| Open | Maxwell Amber Ann | $429,084 | |
| Previous Owner | Smith Jennifer | $389,149 |
Source: Public Records
Tax History
| Year | Tax Paid | Tax Assessment Tax Assessment Total Assessment is a certain percentage of the fair market value that is determined by local assessors to be the total taxable value of land and additions on the property. | Land | Improvement |
|---|---|---|---|---|
| 2025 | $2,988 | $250,250 | $138,507 | $111,743 |
| 2024 | $2,839 | $251,351 | $125,659 | $125,692 |
| 2023 | $2,592 | $438,000 | $229,443 | $208,557 |
| 2022 | $2,717 | $252,451 | $124,823 | $127,628 |
| 2021 | $2,475 | $352,000 | $163,433 | $188,567 |
| 2020 | $525 | $287,000 | $138,860 | $148,140 |
| 2019 | $546 | $286,000 | $141,657 | $144,343 |
| 2018 | $504 | $259,000 | $138,746 | $120,254 |
| 2016 | $416 | $120,175 | $59,029 | $61,146 |
| 2015 | $1,588 | $109,945 | $59,029 | $50,916 |
| 2014 | $1,693 | $121,714 | $59,029 | $62,685 |
| 2013 | -- | $104,662 | $39,809 | $64,853 |
Source: Public Records
Map
Nearby Homes
Your Personal Tour Guide
Ask me questions while you tour the home.