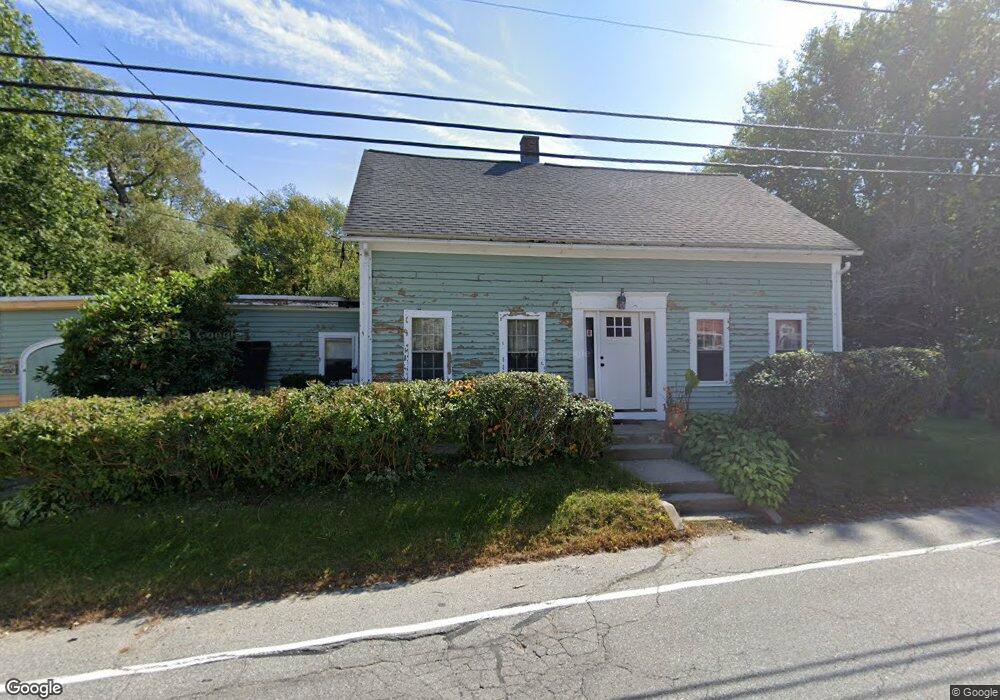
295 W Main St Millbury, MA 01527
Estimated Value: $328,000 - $483,000
4
Beds
2
Baths
1,450
Sq Ft
$273/Sq Ft
Est. Value
About This Home
This home is located at 295 W Main St, Millbury, MA 01527 and is currently estimated at $396,341, approximately $273 per square foot. 295 W Main St is a home located in Worcester County with nearby schools including Elmwood Street Elementary School, Raymond E. Shaw Elementary School, and Millbury Junior/Senior High School.
Ownership History
Date
Name
Owned For
Owner Type
Purchase Details
Closed on
Jul 17, 1998
Sold by
Hutchinos Louis E and Hitchings Kathryn L
Bought by
Carlson William C and Carlson Amy M
Current Estimated Value
Home Financials for this Owner
Home Financials are based on the most recent Mortgage that was taken out on this home.
Original Mortgage
$84,000
Interest Rate
6.98%
Mortgage Type
Purchase Money Mortgage
Purchase Details
Closed on
Dec 2, 1994
Sold by
Wood James G and Wood Dennis
Bought by
Hitchings Louis and Hutchings Kathryn
Create a Home Valuation Report for This Property
The Home Valuation Report is an in-depth analysis detailing your home's value as well as a comparison with similar homes in the area
Home Values in the Area
Average Home Value in this Area
Purchase History
| Date | Buyer | Sale Price | Title Company |
|---|---|---|---|
| Carlson William C | $105,000 | -- | |
| Carlson William C | $105,000 | -- | |
| Hitchings Louis | $100,000 | -- | |
| Hitchings Louis | $100,000 | -- |
Source: Public Records
Mortgage History
| Date | Status | Borrower | Loan Amount |
|---|---|---|---|
| Open | Hitchings Louis | $130,000 | |
| Closed | Hitchings Louis | $20,000 | |
| Closed | Hitchings Louis | $84,000 |
Source: Public Records
Tax History Compared to Growth
Tax History
| Year | Tax Paid | Tax Assessment Tax Assessment Total Assessment is a certain percentage of the fair market value that is determined by local assessors to be the total taxable value of land and additions on the property. | Land | Improvement |
|---|---|---|---|---|
| 2025 | $3,776 | $282,000 | $111,900 | $170,100 |
| 2024 | $3,464 | $261,800 | $103,600 | $158,200 |
| 2023 | $3,085 | $213,500 | $72,700 | $140,800 |
| 2022 | $2,969 | $197,900 | $72,700 | $125,200 |
| 2021 | $9,317 | $192,800 | $72,700 | $120,100 |
| 2020 | $6,042 | $185,500 | $72,700 | $112,800 |
| 2019 | $2,950 | $186,100 | $66,100 | $120,000 |
| 2018 | $3,999 | $163,900 | $66,100 | $97,800 |
| 2017 | $5,831 | $156,500 | $66,100 | $90,400 |
| 2016 | $2,573 | $156,300 | $66,100 | $90,200 |
| 2015 | $2,571 | $156,200 | $70,200 | $86,000 |
| 2014 | $2,416 | $141,300 | $70,200 | $71,100 |
Source: Public Records
Map
Nearby Homes