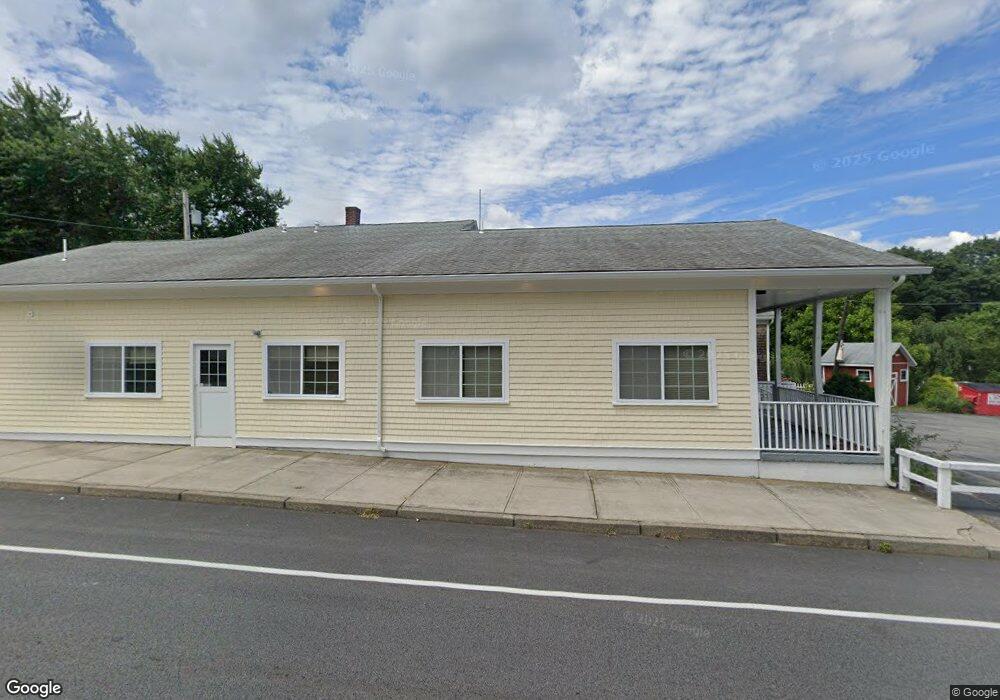
295 Warwick Neck Ave Warwick, RI 02889
Warwick Neck Neighborhood
Studio
--
Bath
4,623
Sq Ft
12,632
Sq Ft Lot
About This Home
This home is located at 295 Warwick Neck Ave, Warwick, RI 02889. 295 Warwick Neck Ave is a home located in Kent County with nearby schools including Saint Kevin School.
Ownership History
Date
Name
Owned For
Owner Type
Purchase Details
Closed on
Sep 7, 2022
Sold by
Rei Of Sunshine Llc
Bought by
Powered By Play Llc
Home Financials for this Owner
Home Financials are based on the most recent Mortgage that was taken out on this home.
Original Mortgage
$1,750,000
Outstanding Balance
$1,667,916
Interest Rate
5.3%
Mortgage Type
Commercial
Purchase Details
Closed on
Dec 8, 2015
Sold by
Rei Of Sunshine Llc
Bought by
Rei Of Sunshine Llc
Purchase Details
Closed on
Jul 25, 2012
Sold by
Us Bank Na
Bought by
Rei Of Sunshine Llc
Purchase Details
Closed on
May 25, 2012
Sold by
Mahoney Jo-Ann M and Jpmorgan Chase Bank Na
Bought by
Jpmorgan Chase Bank Na
Purchase Details
Closed on
Oct 31, 1997
Sold by
Mri Lp
Bought by
Colitta Lawrence D and Colitta Jane
Create a Home Valuation Report for This Property
The Home Valuation Report is an in-depth analysis detailing your home's value as well as a comparison with similar homes in the area
Home Values in the Area
Average Home Value in this Area
Purchase History
| Date | Buyer | Sale Price | Title Company |
|---|---|---|---|
| Powered By Play Llc | $760,000 | None Available | |
| Powered By Play Llc | $760,000 | None Available | |
| Rei Of Sunshine Llc | -- | -- | |
| Rei Of Sunshine Llc | -- | -- | |
| Rei Of Sunshine Llc | $139,000 | -- | |
| Jpmorgan Chase Bank Na | $241,800 | -- | |
| Jpmorgan Chase Bank Na | $241,800 | -- | |
| Colitta Lawrence D | $90,000 | -- | |
| Colitta Lawrence D | $90,000 | -- |
Source: Public Records
Mortgage History
| Date | Status | Borrower | Loan Amount |
|---|---|---|---|
| Open | Powered By Play Llc | $1,750,000 | |
| Closed | Powered By Play Llc | $1,750,000 | |
| Previous Owner | Colitta Lawrence D | $333,250 | |
| Previous Owner | Colitta Lawrence D | $416,750 |
Source: Public Records
Tax History
| Year | Tax Paid | Tax Assessment Tax Assessment Total Assessment is a certain percentage of the fair market value that is determined by local assessors to be the total taxable value of land and additions on the property. | Land | Improvement |
|---|---|---|---|---|
| 2025 | $16,460 | $686,100 | $94,200 | $591,900 |
| 2024 | $17,258 | $681,600 | $81,900 | $599,700 |
| 2023 | $16,924 | $681,600 | $81,900 | $599,700 |
| 2022 | $17,908 | $637,300 | $69,700 | $567,600 |
| 2021 | $17,908 | $637,300 | $69,700 | $567,600 |
| 2020 | $17,908 | $637,300 | $69,700 | $567,600 |
| 2019 | $17,908 | $637,300 | $69,700 | $567,600 |
| 2018 | $17,678 | $566,800 | $81,900 | $484,900 |
| 2017 | $17,208 | $566,800 | $81,900 | $484,900 |
| 2016 | $17,208 | $566,800 | $81,900 | $484,900 |
| 2015 | $10,952 | $351,800 | $39,500 | $312,300 |
| 2014 | $10,586 | $351,800 | $39,500 | $312,300 |
| 2013 | $6,129 | $206,500 | $39,500 | $167,000 |
Source: Public Records
Map
Nearby Homes
- 0 Meadow View Ave
- 43 Beaver Ave
- 357 Warwick Neck Ave
- 585 Meadow View Ave
- 30 White Rock Rd
- 283 Palmer Ave
- 170 Medford St
- 132 Palmer Ave
- 299 Palmer Ave
- 320 Palmer Ave
- 66 Medford St
- 76 Medford St
- 00 Grove Ave
- 15 Center Ct
- 215 Rocky Point Ave
- 205 Payton Ave
- 34 Chapin Ave
- 123 Payton Ave
- 0 Avon Ave
- 14 Beatrice Ave
- 295 Wawick Neck Ave
- 296 Warwick Neck Ave
- 0 Beaver Ave
- 288 Warwick Neck Ave
- 280 Warwick Neck Ave
- 15 Beaver Ave
- 304 Warwick Neck Ave
- 308 Warwick Neck Ave
- 7 Garfield Ave
- 270 Warwick Neck Ave
- 23 Beaver Ave
- 45 State St
- 261 Warwick Neck Ave
- 49 State St
- 260 Warwick Neck Ave
- 257 Warwick Neck Ave
- 53 State St
- 26 Beaver Ave
- 445 Meadow View Ave
- 318 Warwick Neck Ave
Your Personal Tour Guide
Ask me questions while you tour the home.