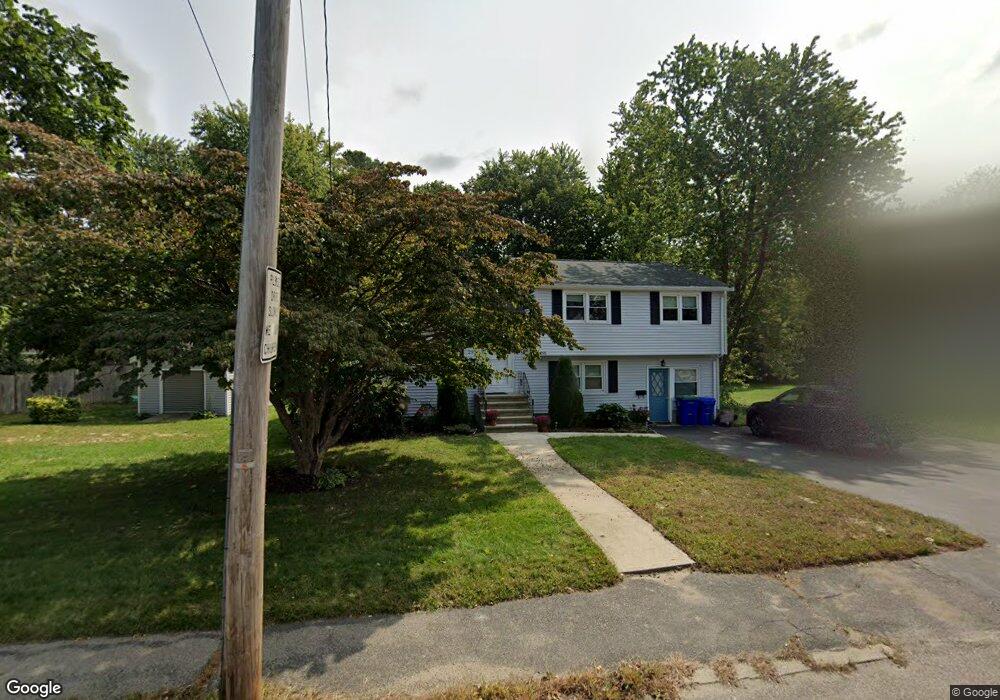
295 Webster St Rockland, MA 02370
Estimated Value: $567,000 - $609,000
3
Beds
2
Baths
1,148
Sq Ft
$512/Sq Ft
Est. Value
About This Home
This home is located at 295 Webster St, Rockland, MA 02370 and is currently estimated at $587,328, approximately $511 per square foot. 295 Webster St is a home located in Plymouth County with nearby schools including Rockland Senior High School, Calvary Chapel Academy, and Holy Family Elementary School.
Ownership History
Date
Name
Owned For
Owner Type
Purchase Details
Closed on
Feb 6, 2024
Sold by
King Debra J
Bought by
Debra J King Ret and King
Current Estimated Value
Purchase Details
Closed on
Mar 3, 2011
Sold by
Ingeno Albert L Est and Ingeno
Bought by
King Debra J
Home Financials for this Owner
Home Financials are based on the most recent Mortgage that was taken out on this home.
Original Mortgage
$162,940
Interest Rate
4.76%
Mortgage Type
Purchase Money Mortgage
Create a Home Valuation Report for This Property
The Home Valuation Report is an in-depth analysis detailing your home's value as well as a comparison with similar homes in the area
Home Values in the Area
Average Home Value in this Area
Purchase History
| Date | Buyer | Sale Price | Title Company |
|---|---|---|---|
| Debra J King Ret | -- | None Available | |
| King Debra J | $203,675 | -- |
Source: Public Records
Mortgage History
| Date | Status | Borrower | Loan Amount |
|---|---|---|---|
| Previous Owner | King Debra J | $162,940 |
Source: Public Records
Tax History Compared to Growth
Tax History
| Year | Tax Paid | Tax Assessment Tax Assessment Total Assessment is a certain percentage of the fair market value that is determined by local assessors to be the total taxable value of land and additions on the property. | Land | Improvement |
|---|---|---|---|---|
| 2025 | $6,452 | $472,000 | $218,900 | $253,100 |
| 2024 | $6,373 | $453,300 | $206,500 | $246,800 |
| 2023 | $6,185 | $406,400 | $179,500 | $226,900 |
| 2022 | $5,970 | $356,400 | $156,000 | $200,400 |
| 2021 | $5,479 | $317,100 | $141,900 | $175,200 |
| 2020 | $5,327 | $304,400 | $135,100 | $169,300 |
| 2019 | $5,200 | $290,200 | $128,700 | $161,500 |
| 2018 | $4,930 | $270,600 | $128,700 | $141,900 |
| 2017 | $4,699 | $254,300 | $128,700 | $125,600 |
| 2016 | $4,436 | $239,900 | $123,800 | $116,100 |
| 2015 | $4,211 | $221,300 | $115,700 | $105,600 |
| 2014 | $3,998 | $218,000 | $113,400 | $104,600 |
Source: Public Records
Map
Nearby Homes
- 21 Archer Rd
- 354 Webster St
- 4 Phillips St
- 45-47 Park St
- 5 Corn Mill Way
- 1 Corn Mill Way
- 206-208 Hingham St
- 83 Summit St
- 49 Liberty St
- 17-23 Dyer St Unit 17
- 13 Dyer St Unit 13
- 11 Dyer St Unit 11
- 94-96 Crescent St
- 14 Dyer St Unit 14
- 12 Dyer St Unit 12
- 440 Market St
- 122 Reed St
- 18 Midfield Dr
- 23 Payson Ave
- 5 Hobart Ln Unit 5