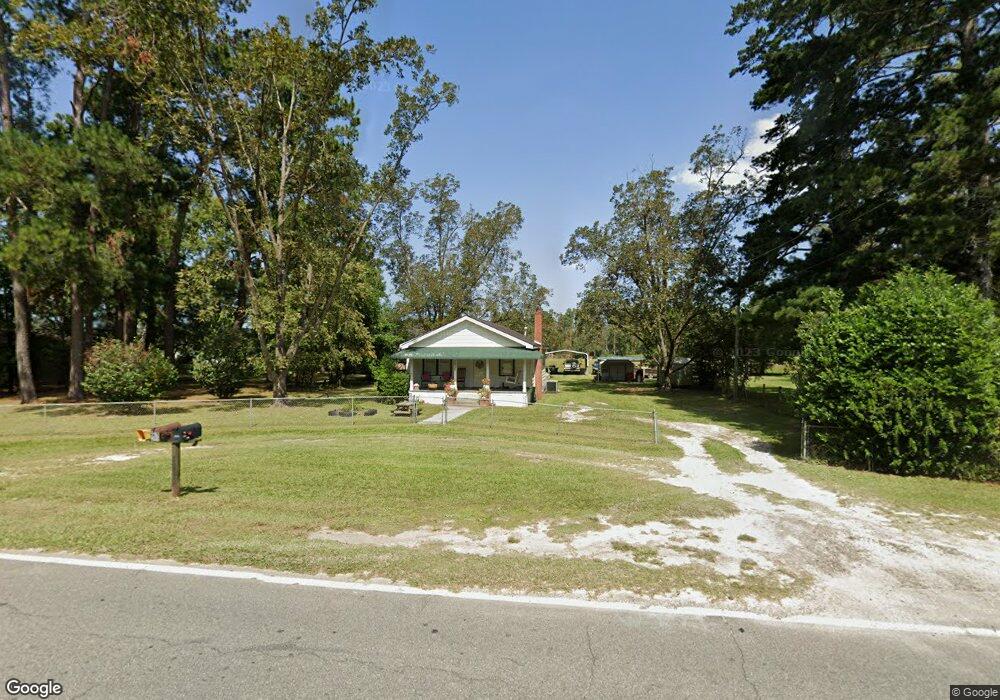
2950 Albany Ave Waycross, GA 31503
Estimated Value: $53,000 - $158,000
--
Bed
1
Bath
912
Sq Ft
$112/Sq Ft
Est. Value
About This Home
This home is located at 2950 Albany Ave, Waycross, GA 31503 and is currently estimated at $101,990, approximately $111 per square foot. 2950 Albany Ave is a home located in Ware County with nearby schools including Waresboro Elementary School, Ware County Middle School, and Ware County High School.
Ownership History
Date
Name
Owned For
Owner Type
Purchase Details
Closed on
Nov 23, 2022
Sold by
L J Welch & Associates Inc
Bought by
Hall April
Current Estimated Value
Purchase Details
Closed on
Aug 8, 2022
Sold by
R J Welch & Son Inc
Bought by
L J Welch & Associates Inc
Purchase Details
Closed on
Oct 18, 2012
Sold by
Sayre Justine
Bought by
R J Welch & Son Inc
Purchase Details
Closed on
May 30, 2012
Sold by
Garrett Donna Faye Chastai
Bought by
Sayre Justine Darcile
Purchase Details
Closed on
Sep 7, 2000
Sold by
Howard Annie M
Bought by
Chastain Darcile
Create a Home Valuation Report for This Property
The Home Valuation Report is an in-depth analysis detailing your home's value as well as a comparison with similar homes in the area
Home Values in the Area
Average Home Value in this Area
Purchase History
| Date | Buyer | Sale Price | Title Company |
|---|---|---|---|
| Hall April | $40,000 | -- | |
| L J Welch & Associates Inc | -- | -- | |
| R J Welch & Son Inc | $13,500 | -- | |
| Sayre Justine Darcile | -- | -- | |
| Chastain Darcile | $20,000 | -- |
Source: Public Records
Tax History Compared to Growth
Tax History
| Year | Tax Paid | Tax Assessment Tax Assessment Total Assessment is a certain percentage of the fair market value that is determined by local assessors to be the total taxable value of land and additions on the property. | Land | Improvement |
|---|---|---|---|---|
| 2024 | $690 | $28,230 | $7,800 | $20,430 |
| 2023 | $727 | $19,666 | $2,496 | $17,170 |
| 2022 | $568 | $19,666 | $2,496 | $17,170 |
| 2021 | $496 | $15,798 | $2,496 | $13,302 |
| 2020 | $465 | $14,664 | $2,496 | $12,168 |
| 2019 | $462 | $14,286 | $2,496 | $11,790 |
| 2018 | $479 | $14,685 | $2,496 | $12,189 |
| 2017 | $479 | $14,685 | $2,496 | $12,189 |
| 2016 | $479 | $14,685 | $2,496 | $12,189 |
| 2015 | $483 | $14,684 | $2,496 | $12,189 |
| 2014 | $483 | $14,685 | $2,496 | $12,189 |
| 2013 | -- | $14,684 | $2,496 | $12,188 |
Source: Public Records
Map
Nearby Homes
- 2885 Longwood Rd
- 2867 Evergreen Rd
- 850 Woodard Ln
- 2836 Evergreen Rd
- 2857 Cherokee St
- 1238 Red Keen Rd
- 1261 Lake St
- 2180 Fulford Rd Unit n/a
- 1210 N Augusta Ave
- 0 Anita South St
- 2117 Tamara Rd
- Lot 155 N Augusta Avenue Cherokee Ave
- 2066 Cherokee St
- 1300 Stanton Ave
- 274 S Anita St
- 400 Smith Rd
- 0 Anita St
- 524 Smith Rd
- 2869 Ben St
- 2879 Ben St
- 2938 Albany Ave
- 2960 Albany Ave
- 2961 Albany Ave
- 2928 Albany Ave
- 2970 Albany Ave
- 2977 Albany Ave
- 2933 Albany Ave
- 2982 Albany Ave
- 2922 Albany Ave
- 2993 Albany Ave
- 2994 Albany Ave
- 2997 Albany Ave
- 2913 Albany Ave
- 1029 Waters Ln
- 2902 Albany Ave
- 3000 Albany Ave
- 3001 Albany Ave
- 3005 Albany Ave
- 2884 Albany Ave
- 3006 Albany Ave