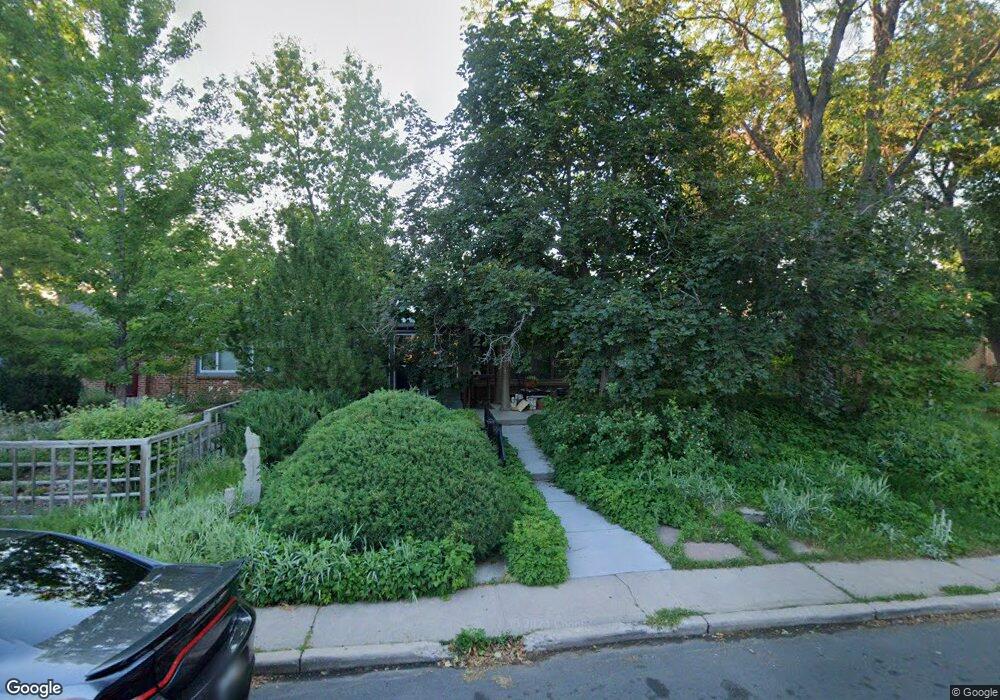
2950 Dahlia St Denver, CO 80207
North Park Hill NeighborhoodEstimated Value: $633,000 - $748,000
2
Beds
1
Bath
2,064
Sq Ft
$327/Sq Ft
Est. Value
About This Home
This home is located at 2950 Dahlia St, Denver, CO 80207 and is currently estimated at $675,637, approximately $327 per square foot. 2950 Dahlia St is a home located in Denver County with nearby schools including Stedman Elementary School, William (Bill) Roberts ECE-8 School, and McAuliffe International School.
Ownership History
Date
Name
Owned For
Owner Type
Purchase Details
Closed on
Apr 6, 2015
Sold by
Price Jack
Bought by
Price Jack and Wells Leola A
Current Estimated Value
Purchase Details
Closed on
Jan 22, 1998
Sold by
Jack Price and Jo Brenda
Bought by
Price Jack
Home Financials for this Owner
Home Financials are based on the most recent Mortgage that was taken out on this home.
Original Mortgage
$60,900
Outstanding Balance
$12,683
Interest Rate
10.75%
Estimated Equity
$662,954
Purchase Details
Closed on
Jan 9, 1998
Sold by
Sadler & Sons Better Homes Investment Co
Bought by
Price Jack and Price Brenda Jo
Home Financials for this Owner
Home Financials are based on the most recent Mortgage that was taken out on this home.
Original Mortgage
$60,900
Outstanding Balance
$12,683
Interest Rate
10.75%
Estimated Equity
$662,954
Create a Home Valuation Report for This Property
The Home Valuation Report is an in-depth analysis detailing your home's value as well as a comparison with similar homes in the area
Home Values in the Area
Average Home Value in this Area
Purchase History
| Date | Buyer | Sale Price | Title Company |
|---|---|---|---|
| Price Jack | -- | None Available | |
| Price Jack | -- | -- | |
| Price Jack | $5,768 | -- |
Source: Public Records
Mortgage History
| Date | Status | Borrower | Loan Amount |
|---|---|---|---|
| Open | Price Jack | $60,900 |
Source: Public Records
Tax History
| Year | Tax Paid | Tax Assessment Tax Assessment Total Assessment is a certain percentage of the fair market value that is determined by local assessors to be the total taxable value of land and additions on the property. | Land | Improvement |
|---|---|---|---|---|
| 2025 | $2,451 | $49,790 | $30,830 | $30,830 |
| 2024 | $2,451 | $37,640 | $25,610 | $12,030 |
| 2023 | $2,397 | $37,640 | $25,610 | $12,030 |
| 2022 | $1,928 | $31,190 | $18,670 | $12,520 |
| 2021 | $1,860 | $32,080 | $19,200 | $12,880 |
| 2020 | $1,627 | $29,080 | $17,870 | $11,210 |
| 2019 | $1,582 | $29,080 | $17,870 | $11,210 |
| 2018 | $1,137 | $21,900 | $14,620 | $7,280 |
| 2017 | $1,689 | $21,900 | $14,620 | $7,280 |
| 2016 | $1,600 | $19,620 | $8,947 | $10,673 |
| 2015 | $1,533 | $19,620 | $8,947 | $10,673 |
| 2014 | $1,215 | $14,630 | $4,227 | $10,403 |
Source: Public Records
Map
Nearby Homes
- 2860 Dahlia St
- 3099 Elm St
- 3070 Cherry St
- 2835 Cherry St
- 2870 Forest St
- 2645 Cherry St
- 3335 Dexter St
- 3065 Bellaire St
- 3011 Grape St
- 5210 E 33rd Ave
- 2827 Bellaire St
- 3607 Grape St
- 3055 Ash St
- 2541 Elm St
- 5085 - 5087 E 34th Ave
- 2620 Bellaire St
- 2865 Hudson St
- 2995 Albion St
- 2826 Hudson St
- 3243 Albion St
Your Personal Tour Guide
Ask me questions while you tour the home.