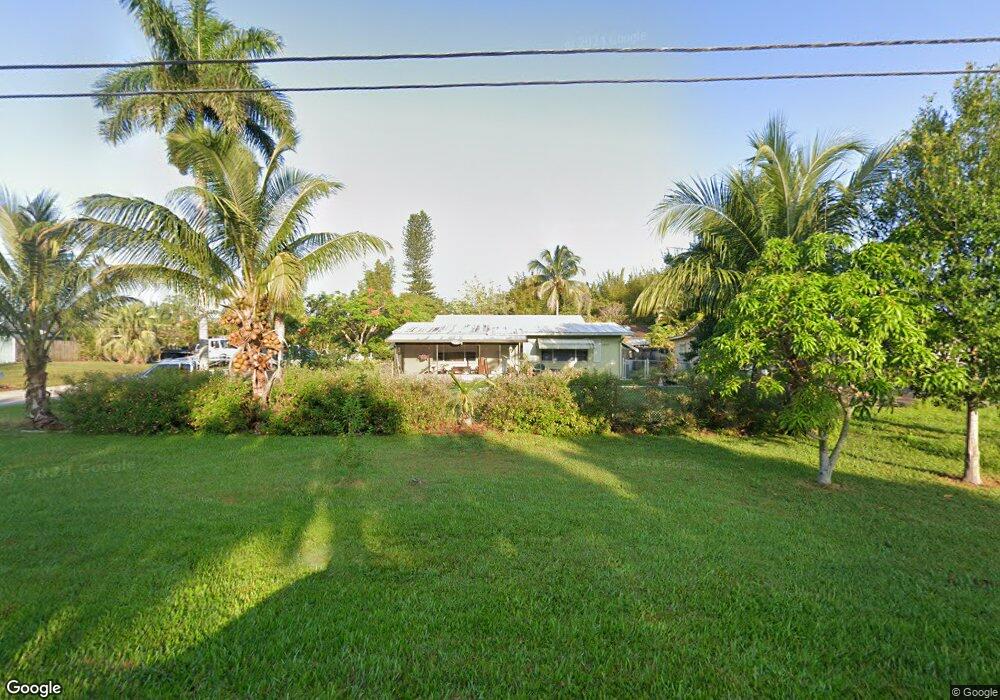
2950 SW Cornell Ave Palm City, FL 34990
Estimated Value: $366,000 - $479,000
3
Beds
2
Baths
1,480
Sq Ft
$281/Sq Ft
Est. Value
About This Home
This home is located at 2950 SW Cornell Ave, Palm City, FL 34990 and is currently estimated at $415,727, approximately $280 per square foot. 2950 SW Cornell Ave is a home located in Martin County with nearby schools including Palm City Elementary School, Hidden Oaks Middle School, and Martin County High School.
Ownership History
Date
Name
Owned For
Owner Type
Purchase Details
Closed on
Mar 20, 2017
Sold by
Adams Arthur C
Bought by
Adams Arthur C and Adams Daniel R
Current Estimated Value
Purchase Details
Closed on
Oct 17, 2013
Sold by
Shoup Ruth E
Bought by
Adams Arthur C
Purchase Details
Closed on
Jun 14, 2010
Sold by
Milan Investments Ii Inc
Bought by
Strout Steven Briard
Purchase Details
Closed on
Jan 26, 2010
Sold by
Corbett James Robert and Corbett Eileen
Bought by
Milan Investments Ii Inc
Purchase Details
Closed on
Jan 19, 2006
Sold by
Tyler Freddie W and Tyler Alice R
Bought by
Corbett James Robert and Corbett Eileen
Home Financials for this Owner
Home Financials are based on the most recent Mortgage that was taken out on this home.
Original Mortgage
$183,600
Interest Rate
6.21%
Mortgage Type
Fannie Mae Freddie Mac
Create a Home Valuation Report for This Property
The Home Valuation Report is an in-depth analysis detailing your home's value as well as a comparison with similar homes in the area
Home Values in the Area
Average Home Value in this Area
Purchase History
| Date | Buyer | Sale Price | Title Company |
|---|---|---|---|
| Adams Arthur C | -- | Attorney | |
| Adams Arthur C | $123,200 | Attorney | |
| Strout Steven Briard | $110,000 | First International Title In | |
| Milan Investments Ii Inc | $84,100 | Attorney | |
| Corbett James Robert | $229,500 | None Available |
Source: Public Records
Mortgage History
| Date | Status | Borrower | Loan Amount |
|---|---|---|---|
| Previous Owner | Corbett James Robert | $183,600 |
Source: Public Records
Tax History Compared to Growth
Tax History
| Year | Tax Paid | Tax Assessment Tax Assessment Total Assessment is a certain percentage of the fair market value that is determined by local assessors to be the total taxable value of land and additions on the property. | Land | Improvement |
|---|---|---|---|---|
| 2025 | $4,888 | $276,312 | -- | -- |
| 2024 | $4,639 | $251,193 | -- | -- |
| 2023 | $4,639 | $228,358 | $0 | $0 |
| 2022 | $4,057 | $207,599 | $0 | $0 |
| 2021 | $3,705 | $188,727 | $0 | $0 |
| 2020 | $3,309 | $171,570 | $115,000 | $56,570 |
| 2019 | $3,208 | $166,730 | $110,000 | $56,730 |
| 2018 | $2,895 | $147,180 | $90,000 | $57,180 |
| 2017 | $2,265 | $134,110 | $85,000 | $49,110 |
| 2016 | $2,469 | $128,020 | $80,000 | $48,020 |
| 2015 | $2,009 | $120,730 | $75,000 | $45,730 |
| 2014 | $2,009 | $104,880 | $55,000 | $49,880 |
Source: Public Records
Map
Nearby Homes
- 872 SW 30th St
- 923 SW 29th St
- 985 SW 29th Terrace
- 942 SW 27th St
- 1030 SW 31st St
- 3529 SW Cornell Ave
- 948 SW 33rd St
- 1287 SW Sunset Trail
- 865 SW 34th Terrace
- 3408 SW Reilley Ave
- 0 Unassigned Unit R11106538
- 0 Unassigned Unit F10513372
- 976 SW 34th Terrace
- 393 SW 35th St Unit 393
- 1524 SW Thelma St
- 788 SW 36th Terrace
- 129 SW Hideaway Place
- 2503 SW Parkside Dr
- 2600 S Kanner Hwy Unit E8
- 2600 S Kanner Hwy Unit Y11
- 2949 SW Cornell Ave
- 2951 SW Cornell Ave
- 866 SW 29th Terrace Unit Main House
- 866 SW 29th Terrace Unit Downstairs
- 866 SW 29th Terrace Unit Upstairs
- 866 SW 29th Terrace
- 2939 SW Cornell Ave
- 2960 SW Cornell Ave
- 2959 SW Cornell Ave
- 2930 SW Cornell Ave
- 2929 SW Cornell Ave
- 2969 SW Cornell Ave
- 895 SW 29th Terrace
- 2990 SW Cornell Ave
- 896 SW 29th Terrace
- 814 SW 29th St
- 2999 SW Cornell Ave
- 871 SW 30th St
- 906 SW 29th Terrace
- 794 SW 29th St