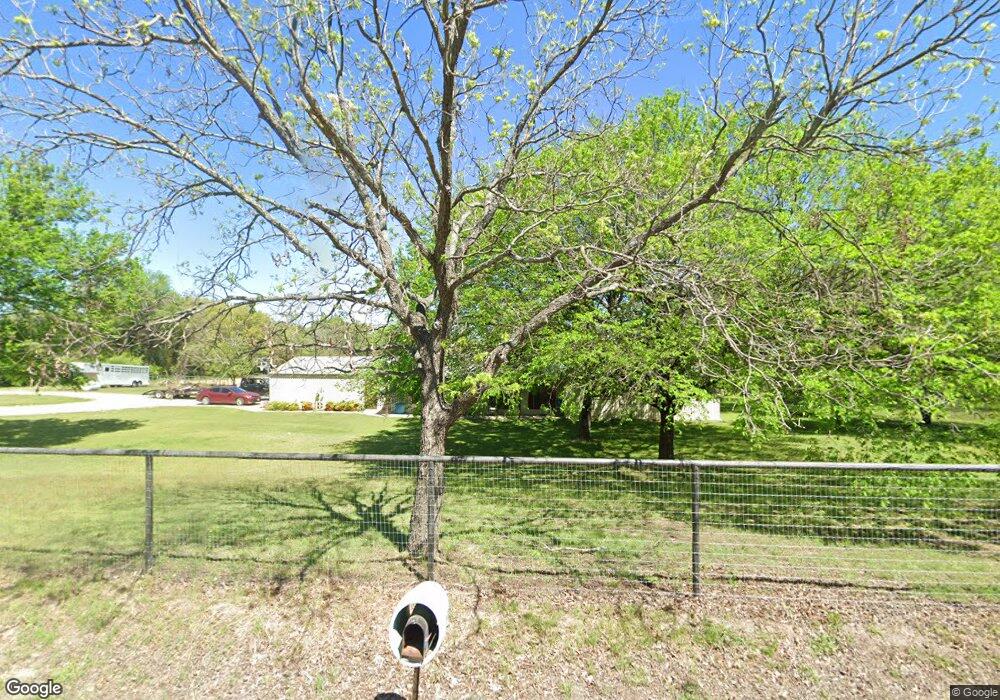
2950 Zion Hill Loop Weatherford, TX 76088
Estimated Value: $372,000 - $534,000
3
Beds
2
Baths
1,800
Sq Ft
$248/Sq Ft
Est. Value
About This Home
This home is located at 2950 Zion Hill Loop, Weatherford, TX 76088 and is currently estimated at $445,731, approximately $247 per square foot. 2950 Zion Hill Loop is a home located in Parker County with nearby schools including Peaster Elementary School, Peaster Middle School, and Peaster High School.
Ownership History
Date
Name
Owned For
Owner Type
Purchase Details
Closed on
Oct 30, 2008
Sold by
Hicks Cody L and Hicks Amy J
Bought by
Kallemeyn Kameron Dawn and Daly Rad Alan
Current Estimated Value
Home Financials for this Owner
Home Financials are based on the most recent Mortgage that was taken out on this home.
Original Mortgage
$135,000
Outstanding Balance
$88,617
Interest Rate
6.08%
Mortgage Type
Purchase Money Mortgage
Estimated Equity
$357,114
Purchase Details
Closed on
Oct 22, 2003
Sold by
Young Sherry Jenail
Bought by
Kallemeyn Kameron D and Daly Rad
Purchase Details
Closed on
Sep 16, 2003
Sold by
Cain Melba Lee
Bought by
Kallemeyn Kameron D and Daly Rad
Purchase Details
Closed on
Apr 17, 2001
Sold by
Young Homer A and Young Sherry
Bought by
Kallemeyn Kameron D and Daly Rad
Purchase Details
Closed on
Oct 11, 1995
Bought by
Kallemeyn Kameron D and Daly Rad
Purchase Details
Closed on
Jan 1, 1901
Bought by
Kallemeyn Kameron D and Daly Rad
Create a Home Valuation Report for This Property
The Home Valuation Report is an in-depth analysis detailing your home's value as well as a comparison with similar homes in the area
Home Values in the Area
Average Home Value in this Area
Purchase History
| Date | Buyer | Sale Price | Title Company |
|---|---|---|---|
| Kallemeyn Kameron Dawn | -- | None Available | |
| Kallemeyn Kameron D | -- | -- | |
| Kallemeyn Kameron D | -- | -- | |
| Kallemeyn Kameron D | -- | -- | |
| Kallemeyn Kameron D | -- | -- | |
| Kallemeyn Kameron D | -- | -- |
Source: Public Records
Mortgage History
| Date | Status | Borrower | Loan Amount |
|---|---|---|---|
| Open | Kallemeyn Kameron Dawn | $135,000 |
Source: Public Records
Tax History Compared to Growth
Tax History
| Year | Tax Paid | Tax Assessment Tax Assessment Total Assessment is a certain percentage of the fair market value that is determined by local assessors to be the total taxable value of land and additions on the property. | Land | Improvement |
|---|---|---|---|---|
| 2025 | $3,849 | $303,960 | $40,080 | $263,880 |
| 2024 | $3,849 | $288,057 | -- | -- |
| 2023 | $3,849 | $261,870 | $0 | $0 |
| 2022 | $4,748 | $253,120 | $17,000 | $236,120 |
| 2021 | $4,351 | $253,120 | $17,000 | $236,120 |
| 2020 | $4,035 | $196,750 | $12,500 | $184,250 |
| 2019 | $3,913 | $196,750 | $12,500 | $184,250 |
| 2018 | $3,568 | $165,080 | $10,000 | $155,080 |
| 2017 | $3,459 | $165,080 | $10,000 | $155,080 |
| 2016 | $3,144 | $146,210 | $7,920 | $138,290 |
| 2015 | $4,288 | $218,780 | $80,490 | $138,290 |
| 2014 | $4,248 | $207,960 | $80,490 | $127,470 |
Source: Public Records
Map
Nearby Homes
- 207 Bay Ct
- 3390 Zion Hill Rd
- 0 La Estada Dr
- 437 Adair Ln
- 3004 Parker Meadows Ct
- 1301 Zion Hill Loop
- 3879 Zion Hill Rd
- 3639 Cedar St
- 280 Latigo Way
- 619 Latigo Ct
- 830 Louis Scherer Rd
- 3533 Fir St
- 2000 Sweet Springs Rd
- 509 Hackamore Ct
- 612 Latigo Ct
- 3667 Oak Cir
- 505 Hackamore Ct
- 3601 Oak Cir
- 2501 Zion Hill Rd
- 2505 Zion Hill Ln Unit 170 - 184 Even Numbe
- 140 Ridge Crest Dr
- 3040 Zion Hill Loop
- 2881 Zion Hill Loop
- 150 Ridge Crest Dr
- 3059 Zion Hill Loop
- 3060 Zion Hill Loop
- 2901 Zion Hill Loop
- 3123 Zion Hill Loop
- 2852 Zion Hill Loop
- 3119 Zion Hill Loop
- 3155 Zion Hill Loop
- 194 Ridge Crest Dr
- 3109 Zion Hill Loop
- 3108 Zion Hill Loop
- 3161 Zion Hill Loop
- 2853 Zion Hill Loop
- 2853 Zion Hill Loop
- 3150 Zion Hill Loop
- 3203 Zion Hill Loop
- 3200 Zion Hill Loop