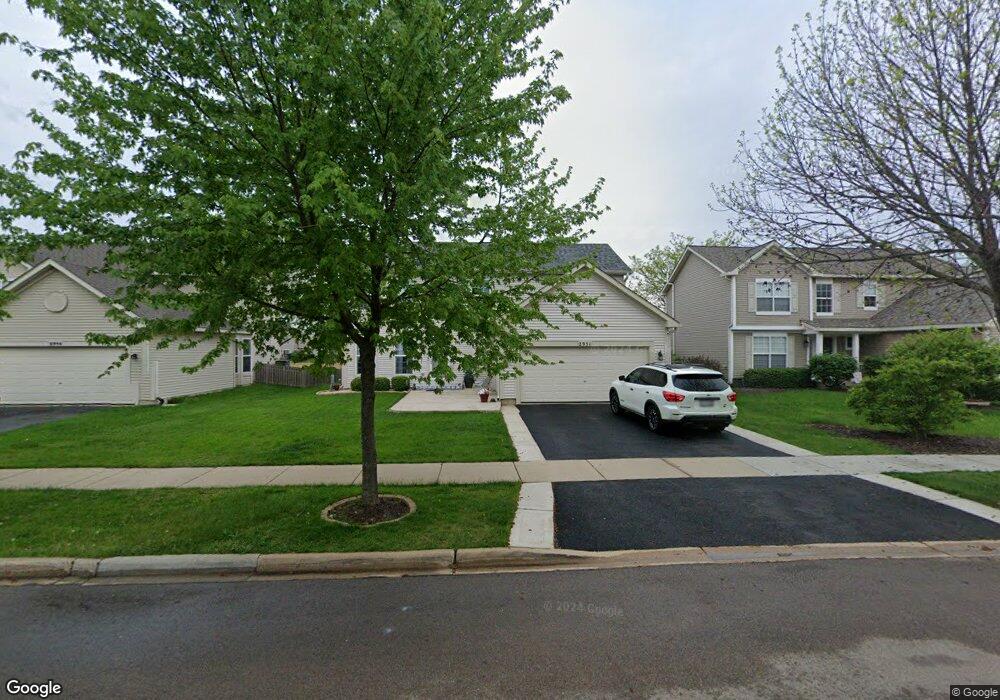
2951 Jacob Ave Unit 1 Montgomery, IL 60538
South Montgomery NeighborhoodEstimated Value: $413,000 - $426,696
6
Beds
4
Baths
2,395
Sq Ft
$176/Sq Ft
Est. Value
About This Home
This home is located at 2951 Jacob Ave Unit 1, Montgomery, IL 60538 and is currently estimated at $421,924, approximately $176 per square foot. 2951 Jacob Ave Unit 1 is a home located in Kendall County with nearby schools including Lakewood Creek Elementary School, Thompson Jr. High School, and Oswego High School.
Ownership History
Date
Name
Owned For
Owner Type
Purchase Details
Closed on
Oct 28, 2021
Sold by
Sanchez Oscar and Arteaga Victor
Bought by
Sanchez Oscar and Vargas Areli
Current Estimated Value
Home Financials for this Owner
Home Financials are based on the most recent Mortgage that was taken out on this home.
Original Mortgage
$181,500
Outstanding Balance
$166,058
Interest Rate
2.88%
Mortgage Type
New Conventional
Estimated Equity
$255,866
Purchase Details
Closed on
Nov 14, 2019
Sold by
Artega Joel
Bought by
Sanchez Oscar and Arteaga Victor
Home Financials for this Owner
Home Financials are based on the most recent Mortgage that was taken out on this home.
Original Mortgage
$180,000
Interest Rate
4.37%
Purchase Details
Closed on
Mar 31, 2004
Sold by
Lakewood Creek West Llc
Bought by
Sanchez Oscar and Arteaga Victor
Home Financials for this Owner
Home Financials are based on the most recent Mortgage that was taken out on this home.
Original Mortgage
$204,900
Interest Rate
5.66%
Mortgage Type
Purchase Money Mortgage
Create a Home Valuation Report for This Property
The Home Valuation Report is an in-depth analysis detailing your home's value as well as a comparison with similar homes in the area
Home Values in the Area
Average Home Value in this Area
Purchase History
| Date | Buyer | Sale Price | Title Company |
|---|---|---|---|
| Sanchez Oscar | -- | Fidelity National Title | |
| Sanchez Oscar | -- | Attorney | |
| Sanchez Oscar | $216,000 | Chicago Title Insurance Co |
Source: Public Records
Mortgage History
| Date | Status | Borrower | Loan Amount |
|---|---|---|---|
| Open | Sanchez Oscar | $181,500 | |
| Previous Owner | Sanchez Oscar | $180,000 | |
| Previous Owner | Sanchez Oscar | $204,900 |
Source: Public Records
Tax History Compared to Growth
Tax History
| Year | Tax Paid | Tax Assessment Tax Assessment Total Assessment is a certain percentage of the fair market value that is determined by local assessors to be the total taxable value of land and additions on the property. | Land | Improvement |
|---|---|---|---|---|
| 2024 | $9,287 | $119,980 | $13,302 | $106,678 |
| 2023 | $8,468 | $107,344 | $11,901 | $95,443 |
| 2022 | $8,468 | $97,452 | $10,804 | $86,648 |
| 2021 | $8,140 | $91,034 | $10,804 | $80,230 |
| 2020 | $7,831 | $86,844 | $10,804 | $76,040 |
| 2019 | $7,628 | $83,511 | $10,389 | $73,122 |
| 2018 | $7,423 | $78,966 | $10,389 | $68,577 |
| 2017 | $7,259 | $73,886 | $10,389 | $63,497 |
| 2016 | $6,847 | $68,606 | $10,389 | $58,217 |
| 2015 | $5,978 | $57,726 | $9,354 | $48,372 |
| 2014 | -- | $55,423 | $9,354 | $46,069 |
| 2013 | -- | $55,423 | $9,354 | $46,069 |
Source: Public Records
Map
Nearby Homes
- 2906 Meadowview Ln
- 2930 Heather Ln Unit 1
- 3026 Gaylord Ln
- 2302 Rebecca Cir Unit 4
- 2286 Margaret Dr
- 2437 Deer Point Dr
- 2891 Frances Ln
- 3066 Troon Dr Unit 2601
- 2257 Rebecca Cir
- 2524 Prairie Crossing Dr
- 2007 Chad Ct
- 3177 Whirlaway Ln
- 3100 Manchester Dr
- Aruba Cove with Full Basement Plan at The Colonies at Grande Reserve - Grande Reserve Ranch Homes
- Cayman Isle with Full Basement Plan at The Colonies at Grande Reserve - Grande Reserve Ranch Homes
- Eden Reef with Full Basement Plan at The Colonies at Grande Reserve - Grande Reserve Ranch Homes
- Bahama Bay with Full Basement Plan at The Colonies at Grande Reserve - Grande Reserve Ranch Homes
- 1850 Candlelight Cir Unit 173
- 1863 Candlelight Cir Unit 1863
- 1722 Newport Ln
- 2945 Jacob Ave Unit 1
- 2957 Jacob Ave Unit 1
- 2963 Jacob Ave Unit 1
- 2939 Jacob Ave
- 2957 Heather Ln Unit 1
- 2969 Jacob Ave Unit 1
- 2933 Jacob Ave Unit 1
- 2942 Jacob Ave Unit 1
- 2954 Heather Ln
- 2951 Heather Ln Unit 1
- 2936 Jacob Ave Unit 1
- 2927 Jacob Ave Unit 1
- 2950 Heather Ln Unit 1
- 2930 Jacob Ave Unit 1
- 2947 Heather Ln Unit 1
- 2340 Riva Ridge Rd
- 2346 Riva Ridge Rd
- 2921 Jacob Ave Unit 1
- 2352 Riva Ridge Rd
- 2928 Meadowview Ln