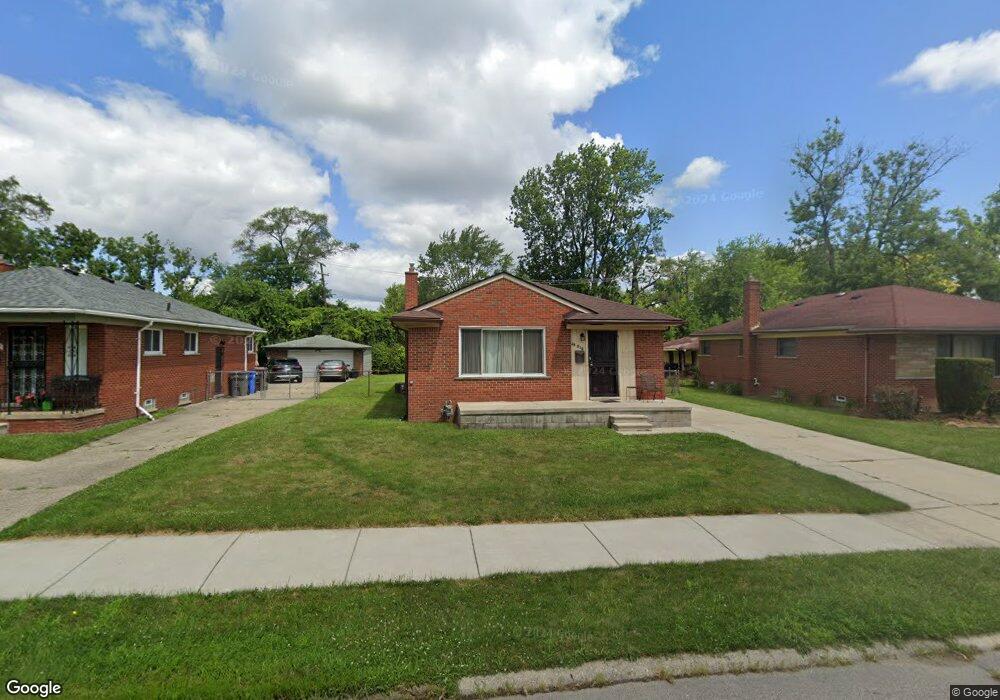
29516 Hazelwood St Inkster, MI 48141
Estimated Value: $118,000 - $138,525
3
Beds
2
Baths
1,066
Sq Ft
$121/Sq Ft
Est. Value
About This Home
This home is located at 29516 Hazelwood St, Inkster, MI 48141 and is currently estimated at $129,381, approximately $121 per square foot. 29516 Hazelwood St is a home located in Wayne County with nearby schools including David Hicks School, Adams Middle School, and Benjamin Franklin Middle School.
Ownership History
Date
Name
Owned For
Owner Type
Purchase Details
Closed on
May 22, 2014
Sold by
Owens Deborah A
Bought by
Miller Reginal L
Current Estimated Value
Purchase Details
Closed on
Dec 5, 2012
Sold by
Owens Deborah A
Bought by
Miller Reginald L and Miller Shirley R
Purchase Details
Closed on
Nov 29, 2010
Sold by
Owens Deborah
Bought by
Owens Deborah and Miller Shirley Renee
Purchase Details
Closed on
Aug 18, 2010
Sold by
Hrobowski Kathryn and Hrobowski Charles
Bought by
Owens Deborah
Purchase Details
Closed on
Oct 2, 2008
Sold by
Hrobowski Charles and Hrobowski Kathryn
Bought by
Hrobowski Charles
Purchase Details
Closed on
Apr 24, 2006
Sold by
Reed Bessie and Reed Karen
Bought by
Hrobowski Kathryn
Home Financials for this Owner
Home Financials are based on the most recent Mortgage that was taken out on this home.
Original Mortgage
$75,000
Interest Rate
6.19%
Mortgage Type
Purchase Money Mortgage
Create a Home Valuation Report for This Property
The Home Valuation Report is an in-depth analysis detailing your home's value as well as a comparison with similar homes in the area
Home Values in the Area
Average Home Value in this Area
Purchase History
| Date | Buyer | Sale Price | Title Company |
|---|---|---|---|
| Miller Reginal L | -- | None Available | |
| Miller Reginald L | -- | None Available | |
| Owens Deborah | -- | None Available | |
| Owens Deborah | $8,000 | Capital Title Ins Agency | |
| Hrobowski Charles | -- | None Available | |
| Hrobowski Kathryn | $60,000 | Michigan Title Agency Inc |
Source: Public Records
Mortgage History
| Date | Status | Borrower | Loan Amount |
|---|---|---|---|
| Previous Owner | Hrobowski Kathryn | $75,000 |
Source: Public Records
Tax History Compared to Growth
Tax History
| Year | Tax Paid | Tax Assessment Tax Assessment Total Assessment is a certain percentage of the fair market value that is determined by local assessors to be the total taxable value of land and additions on the property. | Land | Improvement |
|---|---|---|---|---|
| 2025 | $821 | $54,600 | $0 | $0 |
| 2024 | $821 | $44,100 | $0 | $0 |
| 2023 | $835 | $32,500 | $0 | $0 |
| 2022 | $1,138 | $24,300 | $0 | $0 |
| 2021 | $1,191 | $21,400 | $0 | $0 |
| 2020 | $1,164 | $18,300 | $0 | $0 |
| 2019 | $1,158 | $15,900 | $0 | $0 |
| 2018 | $781 | $14,000 | $0 | $0 |
| 2017 | $613 | $14,100 | $0 | $0 |
| 2016 | $1,130 | $12,400 | $0 | $0 |
| 2015 | $1,580 | $15,800 | $0 | $0 |
| 2013 | $2,210 | $22,100 | $0 | $0 |
| 2012 | $1,718 | $25,100 | $3,400 | $21,700 |
Source: Public Records
Map
Nearby Homes
- 29477 Hazelwood St
- 1435 Jeffrey Ln
- 29142 Parkwood St
- 29522 Grandview St
- 30030 Glenwood St
- 29942 Avondale St
- 29118 Avondale St
- 29221 Barrington St
- 28993 Glenwood St
- 30129 Glenwood St
- 29215 Carlton St
- 29643 Steinhauer St
- 29760 Birchwood St
- 28645 Glenwood St
- 29864 Brooklane St
- 1960 Lexington Pkwy
- 28930 Birchwood St
- 29855 Brooklane St
- 29956 Brooklane St
- 28541 Glenwood St
- 29502 Hazelwood St
- 29534 Hazelwood St
- 29488 Hazelwood St
- 29476 Hazelwood St
- 29548 Hazelwood St
- 29501 Glenwood St
- 29560 Hazelwood St
- 29464 Hazelwood St
- 29489 Glenwood St
- 29531 Glenwood St
- 29477 Glenwood St
- 29543 Glenwood St
- 29513 Hazelwood St
- 29525 Hazelwood St
- 29501 Hazelwood St
- 29452 Hazelwood St
- 29537 Hazelwood St
- 29489 Hazelwood St
- 29453 Glenwood St
- 29555 Glenwood St