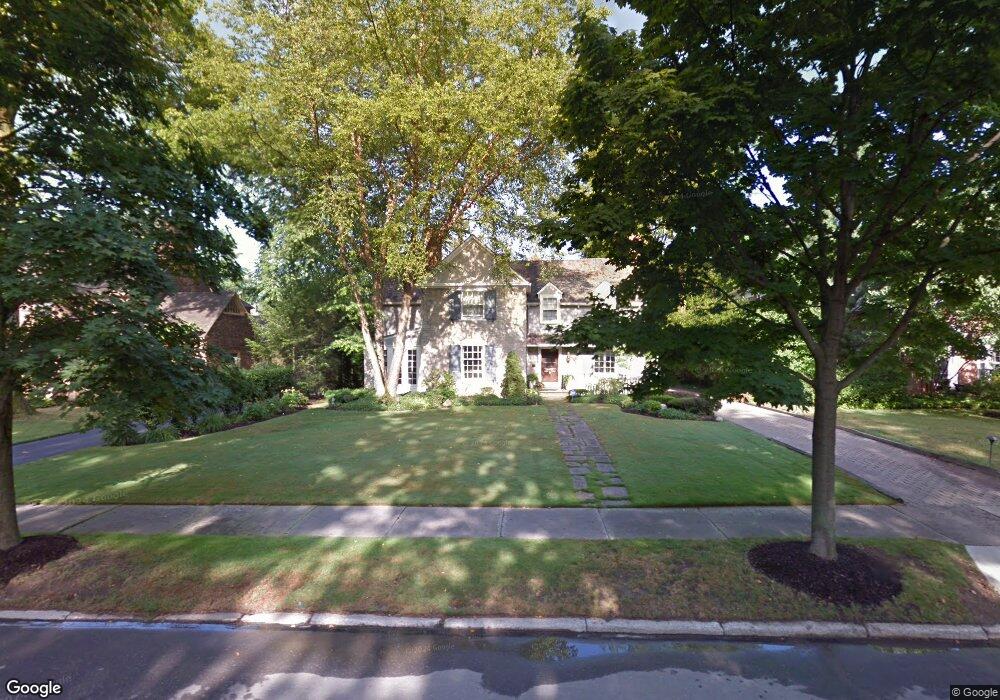
2952 Falmouth Rd Shaker Heights, OH 44122
Estimated Value: $641,000 - $727,000
5
Beds
4
Baths
3,168
Sq Ft
$212/Sq Ft
Est. Value
About This Home
This home is located at 2952 Falmouth Rd, Shaker Heights, OH 44122 and is currently estimated at $672,080, approximately $212 per square foot. 2952 Falmouth Rd is a home located in Cuyahoga County with nearby schools including Onaway Elementary School, Woodbury Elementary School, and Shaker Heights Middle School.
Ownership History
Date
Name
Owned For
Owner Type
Purchase Details
Closed on
Jun 19, 2013
Sold by
Morris Sean M and Morris Shannon L
Bought by
Vakharia Nirav and Vakharia Aarti
Current Estimated Value
Home Financials for this Owner
Home Financials are based on the most recent Mortgage that was taken out on this home.
Original Mortgage
$328,000
Outstanding Balance
$232,696
Interest Rate
3.43%
Mortgage Type
New Conventional
Estimated Equity
$439,384
Purchase Details
Closed on
May 21, 2012
Sold by
Heckaman Maria K
Bought by
Morris Sean M and Morris Shannon L
Home Financials for this Owner
Home Financials are based on the most recent Mortgage that was taken out on this home.
Original Mortgage
$341,701
Interest Rate
3.89%
Mortgage Type
New Conventional
Purchase Details
Closed on
Mar 14, 1986
Sold by
Murray George M 111
Bought by
Heckaman Maria K
Purchase Details
Closed on
Jan 14, 1986
Sold by
Johnston Martha D
Bought by
Murray George M 111
Purchase Details
Closed on
Feb 6, 1980
Sold by
Johnston Joseph W and Johnston Martha D
Bought by
Johnston Martha D
Purchase Details
Closed on
Jan 1, 1975
Bought by
Johnston Joseph W and Johnston Martha D
Create a Home Valuation Report for This Property
The Home Valuation Report is an in-depth analysis detailing your home's value as well as a comparison with similar homes in the area
Home Values in the Area
Average Home Value in this Area
Purchase History
| Date | Buyer | Sale Price | Title Company |
|---|---|---|---|
| Vakharia Nirav | $410,000 | Ohio Real Title | |
| Morris Sean M | $375,500 | Signature Title | |
| Heckaman Maria K | $173,000 | -- | |
| Murray George M 111 | $80,000 | -- | |
| Johnston Martha D | -- | -- | |
| Johnston Joseph W | -- | -- |
Source: Public Records
Mortgage History
| Date | Status | Borrower | Loan Amount |
|---|---|---|---|
| Open | Vakharia Nirav | $328,000 | |
| Previous Owner | Morris Sean M | $341,701 |
Source: Public Records
Tax History Compared to Growth
Tax History
| Year | Tax Paid | Tax Assessment Tax Assessment Total Assessment is a certain percentage of the fair market value that is determined by local assessors to be the total taxable value of land and additions on the property. | Land | Improvement |
|---|---|---|---|---|
| 2024 | $16,601 | $186,445 | $32,970 | $153,475 |
| 2023 | $16,361 | $145,540 | $31,330 | $114,210 |
| 2022 | $15,877 | $145,530 | $31,330 | $114,210 |
| 2021 | $15,823 | $145,530 | $31,330 | $114,210 |
| 2020 | $16,491 | $142,660 | $30,700 | $111,970 |
| 2019 | $16,253 | $407,600 | $87,700 | $319,900 |
| 2018 | $16,494 | $150,610 | $30,700 | $119,910 |
| 2017 | $16,421 | $136,330 | $25,170 | $111,160 |
| 2016 | $15,761 | $136,330 | $25,170 | $111,160 |
| 2015 | $14,516 | $136,330 | $25,170 | $111,160 |
| 2014 | $14,516 | $120,960 | $23,730 | $97,230 |
Source: Public Records
Map
Nearby Homes
- 19200 S Woodland Rd
- 3133 Somerset Dr
- 3180 Somerset Dr
- 20962 Sydenham Rd
- 3279 Warrensville Center Rd Unit 3 A
- 3279 Warrensville Center Rd Unit 15D
- 21262 S Woodland Rd
- 19901 Van Aken Blvd Unit C-106
- 19901 Van Aken Blvd Unit 205C
- 19901 Van Aken Blvd Unit 7
- 19201 Van Aken Blvd Unit 211
- 19201 Van Aken Blvd Unit 114
- 19201 Van Aken Blvd Unit 510
- 19201 Van Aken Blvd Unit 513
- 19101 Van Aken Blvd Unit 219
- 2945 Fontenay Rd
- 20975 Farnsleigh Rd
- 20601 Shelburne Rd
- 3148 Belvoir Blvd
- 19015 Van Aken Blvd Unit 516
- 2964 Falmouth Rd
- 2940 Falmouth Rd
- 2951 Montgomery Rd
- 2976 Falmouth Rd
- 2963 Montgomery Rd
- 2939 Montgomery Rd
- 2928 Falmouth Rd
- 2951 Falmouth Rd
- 2937 Falmouth Rd
- 2973 Montgomery Rd
- 2963 Falmouth Rd
- 2986 Falmouth Rd
- 2927 Falmouth Rd
- 2975 Falmouth Rd
- 2985 Montgomery Rd
- 2917 Falmouth Rd
- 2996 Falmouth Rd
- 2985 Falmouth Rd
- 2995 Montgomery Rd
- 2952 Montgomery Rd