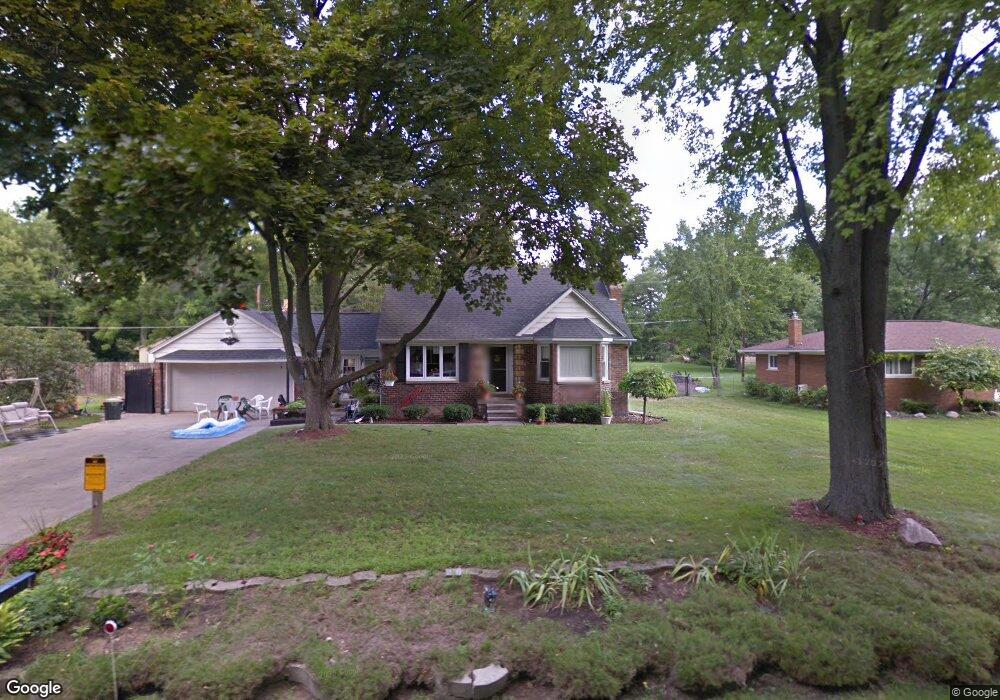
29530 Wentworth St Livonia, MI 48154
Estimated Value: $290,701 - $329,000
4
Beds
2
Baths
1,344
Sq Ft
$226/Sq Ft
Est. Value
About This Home
This home is located at 29530 Wentworth St, Livonia, MI 48154 and is currently estimated at $303,675, approximately $225 per square foot. 29530 Wentworth St is a home located in Wayne County with nearby schools including Riley Upper Elementary School, Buchanan Elementary School, and Holmes Middle School.
Ownership History
Date
Name
Owned For
Owner Type
Purchase Details
Closed on
Oct 11, 2024
Sold by
Merrill Vickie Sue
Bought by
Vickie Merrill Trust and Merrill
Current Estimated Value
Purchase Details
Closed on
Mar 19, 2013
Sold by
Merrill Vickie Sue and Donnelly Carol Ann
Bought by
Merrill Vickie Sue
Purchase Details
Closed on
Sep 14, 2006
Sold by
Merrill Brett Travis
Bought by
Merrill Vickie Sue
Purchase Details
Closed on
Aug 28, 2006
Sold by
Merrill Vickie Sue
Bought by
Merill Vickie Sue
Create a Home Valuation Report for This Property
The Home Valuation Report is an in-depth analysis detailing your home's value as well as a comparison with similar homes in the area
Home Values in the Area
Average Home Value in this Area
Purchase History
| Date | Buyer | Sale Price | Title Company |
|---|---|---|---|
| Vickie Merrill Trust | -- | None Listed On Document | |
| Vickie Merrill Trust | -- | None Listed On Document | |
| Merrill Vickie Sue | -- | None Available | |
| Merrill Vickie Sue | -- | None Available | |
| Merill Vickie Sue | -- | Independence Title |
Source: Public Records
Tax History Compared to Growth
Tax History
| Year | Tax Paid | Tax Assessment Tax Assessment Total Assessment is a certain percentage of the fair market value that is determined by local assessors to be the total taxable value of land and additions on the property. | Land | Improvement |
|---|---|---|---|---|
| 2025 | $1,445 | $132,100 | $0 | $0 |
| 2024 | $1,445 | $112,300 | $0 | $0 |
| 2023 | $1,379 | $108,300 | $0 | $0 |
| 2022 | $2,421 | $101,000 | $0 | $0 |
| 2021 | $2,352 | $98,000 | $0 | $0 |
| 2019 | $2,256 | $94,100 | $0 | $0 |
| 2018 | $1,166 | $82,700 | $0 | $0 |
| 2017 | $2,063 | $81,400 | $0 | $0 |
| 2016 | $2,059 | $79,600 | $0 | $0 |
| 2015 | $4,985 | $63,010 | $0 | $0 |
| 2012 | -- | $48,300 | $26,000 | $22,300 |
Source: Public Records
Map
Nearby Homes
- 15608 Hidden Ln
- 29766 Puritan St
- 29106 Broadmoor St
- 28692 Bayberry Park Dr
- 29760 Hoy St
- 30115 Munger Dr
- 14962 Beatrice St
- 30425 Munger Dr
- 29945 6 Mile Rd
- 29831 Oakley St
- 15345 Bainbridge St
- 31005 Roycroft St
- 29836 Bobrich St
- 31069 Munger Dr
- 15681 Foch St
- 29631 Lyndon St
- 27510 Five Mile Rd
- 27480 5 Mile Rd
- 14920 Taylor Blvd
- 14907 Taylor Blvd
- 29522 Wentworth St
- 29550 Wentworth St
- 29570 Wentworth St
- 29518 Wentworth St
- 29575 Wentworth St
- 29600 Wentworth St
- 29586 Wentworth St
- 15949 Middlebelt Rd
- 15959 Middlebelt Rd
- 29606 Wentworth St
- 29535 Puritan St
- 29521 Puritan St
- 29614 Wentworth St
- 29515 Puritan St
- 29561 Puritan St
- 15965 Middlebelt Rd Unit Bldg-Unit
- 15965 Middlebelt Rd
- 15825 Middlebelt Rd
- 29519 Puritan St
- 15873 Middlebelt Rd