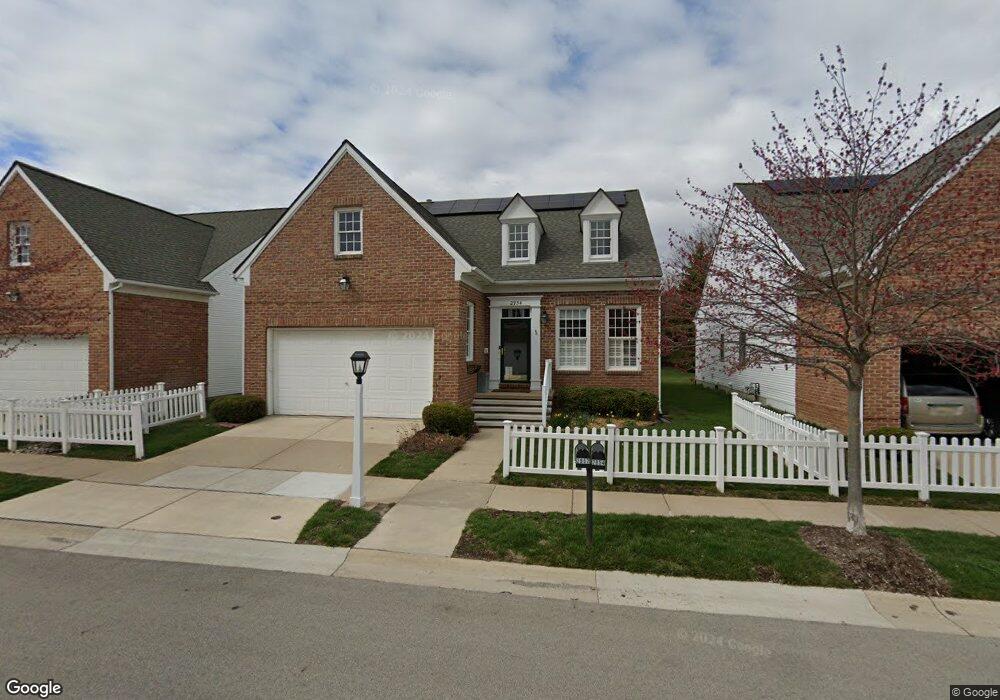
2954 Philadelphia Dr Unit 43 Ann Arbor, MI 48103
Liberty Glen NeighborhoodEstimated Value: $368,000 - $591,000
4
Beds
3
Baths
1,579
Sq Ft
$310/Sq Ft
Est. Value
About This Home
This home is located at 2954 Philadelphia Dr Unit 43, Ann Arbor, MI 48103 and is currently estimated at $489,147, approximately $309 per square foot. 2954 Philadelphia Dr Unit 43 is a home located in Washtenaw County with nearby schools including Lakewood Elementary School, Forsythe Middle School, and Skyline High School.
Ownership History
Date
Name
Owned For
Owner Type
Purchase Details
Closed on
Nov 21, 2023
Sold by
Schmerl Sonia
Bought by
Schmerl Sonia
Current Estimated Value
Purchase Details
Closed on
Jun 18, 2021
Sold by
Blunt Joan C
Bought by
Schmeri Sonia
Purchase Details
Closed on
Jul 12, 2011
Sold by
Blunt Lynn W and Blunt Joan C
Bought by
Blunt Lynn W and Blunt Joan C
Purchase Details
Closed on
Jan 12, 2000
Sold by
Simon Margie G
Bought by
Harris David M
Purchase Details
Closed on
Dec 17, 1999
Sold by
Limited Partnership Empi
Bought by
Singh Sukhdial
Purchase Details
Closed on
Sep 22, 1999
Sold by
Myers Dorothy
Bought by
Sharp Dorothy
Purchase Details
Closed on
Nov 17, 1998
Sold by
Liberty Oaks Llc
Bought by
Liberty Oaks Homes Llc
Purchase Details
Closed on
Aug 18, 1998
Sold by
Liberty Oaks Homes Llc
Bought by
Liberty Oaks Homes Llc
Create a Home Valuation Report for This Property
The Home Valuation Report is an in-depth analysis detailing your home's value as well as a comparison with similar homes in the area
Home Values in the Area
Average Home Value in this Area
Purchase History
| Date | Buyer | Sale Price | Title Company |
|---|---|---|---|
| Schmerl Sonia | -- | None Listed On Document | |
| Schmeri Sonia | $390,000 | None Available | |
| Blunt Lynn W | -- | None Available | |
| Harris David M | $80,000 | -- | |
| Singh Sukhdial | $137,182 | -- | |
| Sharp Dorothy | $213,500 | -- | |
| Liberty Oaks Homes Llc | $34,500 | -- | |
| Liberty Oaks Homes Llc | $50,000 | -- |
Source: Public Records
Tax History Compared to Growth
Tax History
| Year | Tax Paid | Tax Assessment Tax Assessment Total Assessment is a certain percentage of the fair market value that is determined by local assessors to be the total taxable value of land and additions on the property. | Land | Improvement |
|---|---|---|---|---|
| 2025 | $10,023 | $234,400 | $0 | $0 |
| 2024 | $9,334 | $223,900 | $0 | $0 |
| 2023 | $8,606 | $206,000 | $0 | $0 |
| 2022 | $9,262 | $182,100 | $0 | $0 |
| 2021 | $7,185 | $190,500 | $0 | $0 |
| 2020 | $7,040 | $183,600 | $0 | $0 |
| 2019 | $6,700 | $191,300 | $191,300 | $0 |
| 2018 | $6,606 | $177,900 | $0 | $0 |
| 2017 | $6,426 | $178,400 | $0 | $0 |
| 2016 | $5,473 | $128,494 | $0 | $0 |
| 2015 | $5,904 | $128,110 | $0 | $0 |
| 2014 | $5,904 | $124,108 | $0 | $0 |
| 2013 | -- | $124,108 | $0 | $0 |
Source: Public Records
Map
Nearby Homes
- 609 Liberty Pointe Dr Unit 45
- 324 Highlake Ave
- 922 W Summerfield Glen Cir Unit 110
- 1008 W Summerfield Glen Cir
- 2564 W Towne St
- 3177 Sunnywood Dr
- 570 S Maple Rd
- 2509 W Liberty St
- 3224 Lakewood Dr
- 1053 Bluestem Ln
- 2149 Fair St
- 1235 S Maple Rd Unit 101
- 1235 S Maple Rd Unit 202
- 1225 S Maple Rd Unit 307
- 1366 N Bay Dr Unit 144
- 1265 S Maple Rd Unit 207
- 2052 Liberty Heights
- 2120 Pauline Blvd Unit 305
- 2107 Jackson Ave
- 1419 N Bay Dr Unit 73
- 2954 Philadelphia Dr
- 2954 Philadelphia St
- 2954 Philadelphia St Unit 43
- 2944 Philadelphia Dr
- 2964 Philadelphia Dr
- 2944 Philadelphia St
- 2934 Philadelphia Dr
- 2974 Philadelphia Dr
- 0 Philadelphia St
- 2957 Philadelphia Dr Unit 32
- 2924 Philadelphia Dr Unit 40
- 2967 Philadelphia St
- 2947 Philadelphia Dr
- 2967 Philadelphia Dr Unit 31
- 2937 Philadelphia Dr Unit 34
- 2977 Philadelphia Dr Unit 30
- 2914 Philadelphia Dr
- 2927 Philadelphia Dr
- 0 Burr Oak Dr
- 508 Liberty Pointe Dr