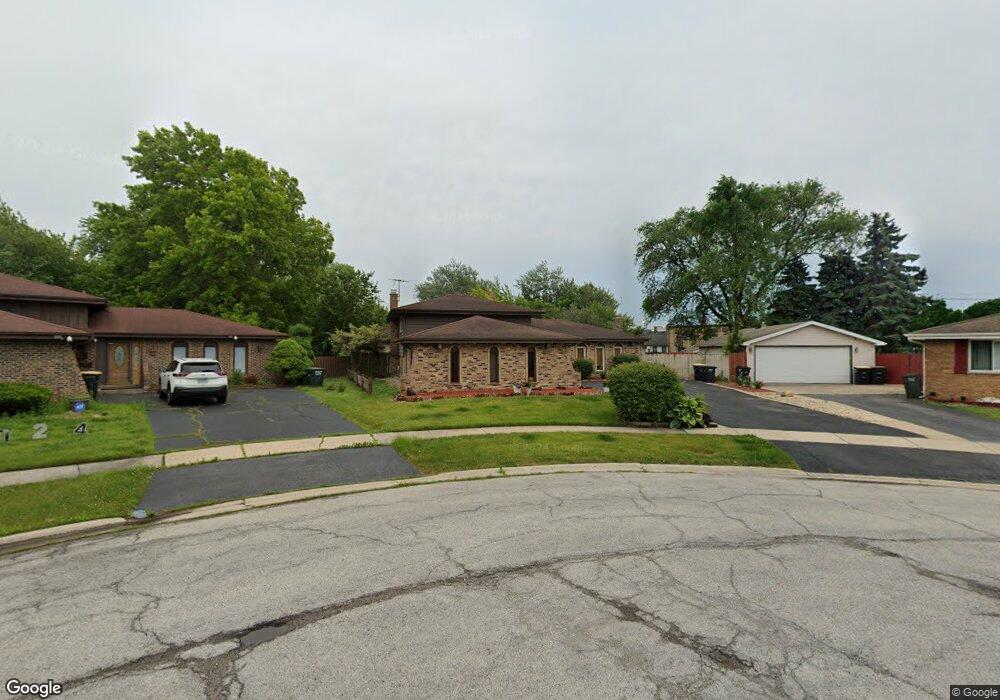
2955 173rd Place Lansing, IL 60438
Estimated Value: $209,000 - $255,000
4
Beds
2
Baths
1,250
Sq Ft
$188/Sq Ft
Est. Value
About This Home
This home is located at 2955 173rd Place, Lansing, IL 60438 and is currently estimated at $234,831, approximately $187 per square foot. 2955 173rd Place is a home located in Cook County with nearby schools including Reavis Elementary School, Memorial Jr High School, and Thornton Fractnl So High School.
Ownership History
Date
Name
Owned For
Owner Type
Purchase Details
Closed on
Aug 7, 2023
Sold by
Warren Sheila
Bought by
Warren Sheila and Warren Sheila
Current Estimated Value
Purchase Details
Closed on
Sep 11, 2014
Sold by
Sannito Scott J
Bought by
Warren Sheila
Purchase Details
Closed on
Jun 21, 2001
Sold by
Sannito Scott J
Bought by
Sannito Scott J and Sannito Kristen M
Home Financials for this Owner
Home Financials are based on the most recent Mortgage that was taken out on this home.
Original Mortgage
$98,000
Interest Rate
7.2%
Purchase Details
Closed on
Oct 4, 1999
Sold by
Sannito Peggy J and Ariano Edward J
Bought by
Sannito Scott J
Home Financials for this Owner
Home Financials are based on the most recent Mortgage that was taken out on this home.
Original Mortgage
$80,000
Interest Rate
7.83%
Create a Home Valuation Report for This Property
The Home Valuation Report is an in-depth analysis detailing your home's value as well as a comparison with similar homes in the area
Home Values in the Area
Average Home Value in this Area
Purchase History
| Date | Buyer | Sale Price | Title Company |
|---|---|---|---|
| Warren Sheila | -- | None Listed On Document | |
| Warren Sheila | $39,500 | None Available | |
| Sannito Scott J | -- | -- | |
| Sannito Scott J | $100,000 | First American Title |
Source: Public Records
Mortgage History
| Date | Status | Borrower | Loan Amount |
|---|---|---|---|
| Previous Owner | Sannito Scott J | $98,000 | |
| Previous Owner | Sannito Scott J | $80,000 |
Source: Public Records
Tax History Compared to Growth
Tax History
| Year | Tax Paid | Tax Assessment Tax Assessment Total Assessment is a certain percentage of the fair market value that is determined by local assessors to be the total taxable value of land and additions on the property. | Land | Improvement |
|---|---|---|---|---|
| 2024 | $7,105 | $18,000 | $7,482 | $10,518 |
| 2023 | $4,339 | $18,000 | $7,482 | $10,518 |
| 2022 | $4,339 | $10,097 | $6,547 | $3,550 |
| 2021 | $4,277 | $10,096 | $6,547 | $3,549 |
| 2020 | $4,103 | $10,096 | $6,547 | $3,549 |
| 2019 | $5,955 | $13,890 | $6,079 | $7,811 |
| 2018 | $5,842 | $13,890 | $6,079 | $7,811 |
| 2017 | $5,933 | $13,890 | $6,079 | $7,811 |
| 2016 | $5,232 | $12,066 | $5,611 | $6,455 |
| 2015 | $4,797 | $12,066 | $5,611 | $6,455 |
| 2014 | $4,759 | $12,066 | $5,611 | $6,455 |
| 2013 | $4,593 | $12,831 | $5,611 | $7,220 |
Source: Public Records
Map
Nearby Homes
- 3010 Bernice Rd Unit 303
- 17303 Chicago Ave
- 3026 Bernice Rd Unit 308
- 3425 Bernice Ave
- 2830 Bernice Rd
- 17157 Chicago Ave
- 3127 Bernice Rd Unit 2
- 3127 Bernice Rd Unit 6
- 17130 Park Ave
- 17415 Burnham Ave
- 17137 Greenbay Ave
- 17138 Burnham Ave
- 17048 Lorenz Ave
- 17419 Walter St
- 17153 Burnham Ave
- 17557 Burnham Ave
- 17132 Walter St
- 17157 Walter St
- 17153 Walter St
- 17002 Chicago Ave
- 2965 173rd Place
- 2945 173rd Place
- 2940 Bernice Rd Unit 2E
- 2940 Bernice Rd Unit 1E
- 2940 Bernice Rd Unit 1W
- 2940 Bernice Rd Unit 2W
- 2940 Bernice Rd
- 2944 Bernice Rd
- 17338 Chicago Ave
- 2950 Bernice Rd
- 17342 Chicago Ave
- 2979 173rd Place
- 2971 173rd Place
- 2931 173rd Place
- 2987 173rd Place
- 17330 Chicago Ave
- 17324 Chicago Ave
- 2960 Bernice Rd
- 2923 173rd Place
- 2928 173rd Place