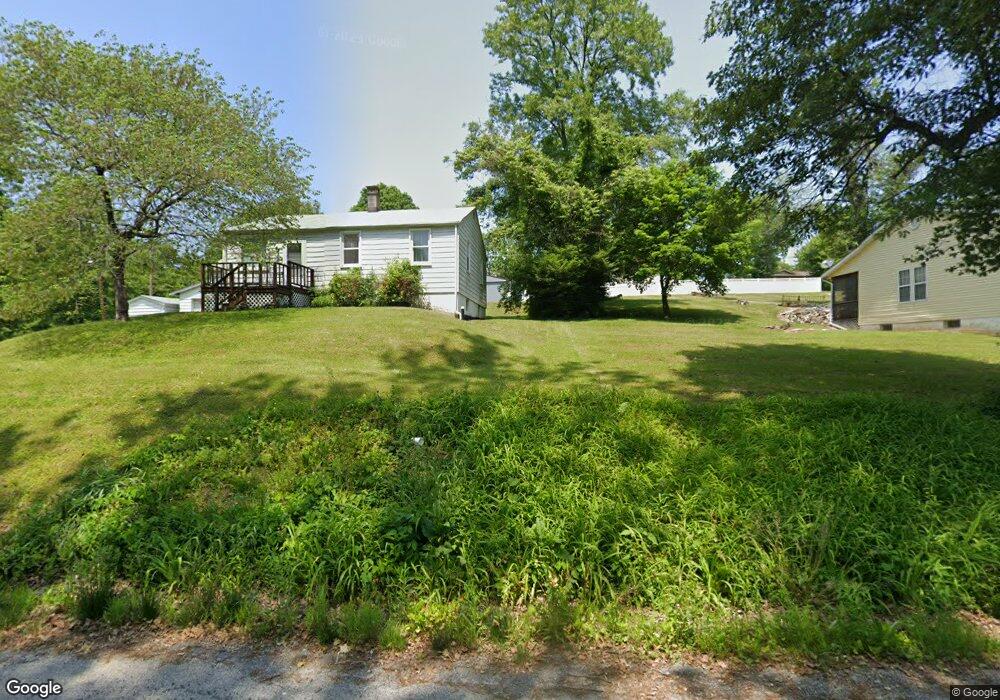
2955 Leland Dr Belleville, IL 62226
Estimated Value: $79,419 - $244,000
Studio
--
Bath
1,440
Sq Ft
$124/Sq Ft
Est. Value
About This Home
This home is located at 2955 Leland Dr, Belleville, IL 62226 and is currently estimated at $178,605, approximately $124 per square foot. 2955 Leland Dr is a home located in St. Clair County with nearby schools including Henry Raab Elementary School, Central Jr High School, and Governor French Academy.
Ownership History
Date
Name
Owned For
Owner Type
Purchase Details
Closed on
Sep 27, 2007
Sold by
Jordan Richard and Jordan Tamela
Bought by
Wolf Ernest and Wolf Patricia
Current Estimated Value
Purchase Details
Closed on
Mar 13, 2006
Sold by
Estate Of Leland Kraft
Bought by
Jordan Richard and Jordan Tamela
Home Financials for this Owner
Home Financials are based on the most recent Mortgage that was taken out on this home.
Original Mortgage
$85,000
Interest Rate
6.37%
Mortgage Type
Construction
Create a Home Valuation Report for This Property
The Home Valuation Report is an in-depth analysis detailing your home's value as well as a comparison with similar homes in the area
Home Values in the Area
Average Home Value in this Area
Purchase History
| Date | Buyer | Sale Price | Title Company |
|---|---|---|---|
| Wolf Ernest | $16,000 | Chicago Title | |
| Jordan Richard | $25,000 | Chicago Title Insurance Co |
Source: Public Records
Mortgage History
| Date | Status | Borrower | Loan Amount |
|---|---|---|---|
| Previous Owner | Jordan Richard | $85,000 |
Source: Public Records
Tax History
| Year | Tax Paid | Tax Assessment Tax Assessment Total Assessment is a certain percentage of the fair market value that is determined by local assessors to be the total taxable value of land and additions on the property. | Land | Improvement |
|---|---|---|---|---|
| 2024 | $871 | $11,709 | $5,532 | $6,177 |
| 2023 | $888 | $11,259 | $5,457 | $5,802 |
| 2022 | $829 | $10,254 | $4,970 | $5,284 |
| 2021 | $820 | $9,833 | $4,766 | $5,067 |
| 2020 | $794 | $9,157 | $4,438 | $4,719 |
| 2019 | $819 | $9,681 | $4,528 | $5,153 |
| 2018 | $806 | $9,433 | $4,412 | $5,021 |
| 2017 | $791 | $9,182 | $4,295 | $4,887 |
| 2016 | $794 | $8,866 | $4,147 | $4,719 |
| 2014 | $599 | $7,550 | $2,999 | $4,551 |
| 2013 | $614 | $7,550 | $2,999 | $4,551 |
Source: Public Records
Map
Nearby Homes