
Landlord's Agent in 2021
Laura Prichinello
MyBeach Vacation Rentals
(843) 631-7368
Estimated Value: $239,000 - $275,000
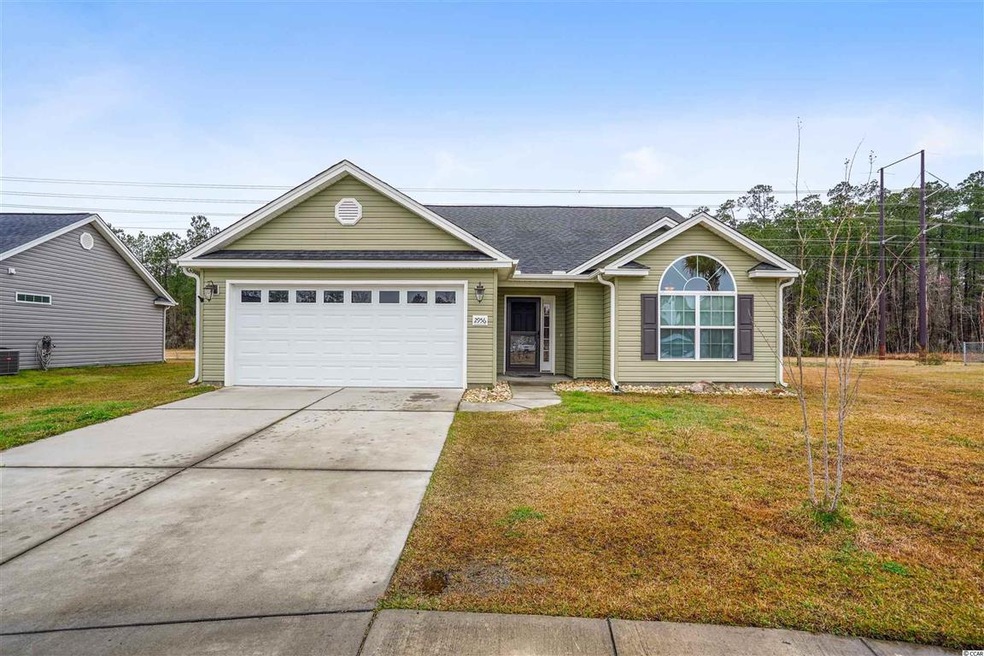
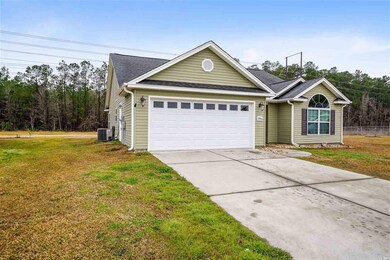
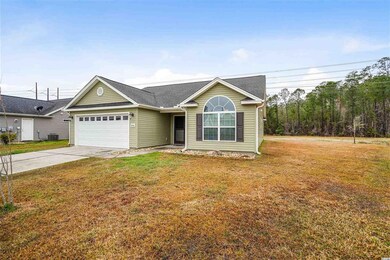
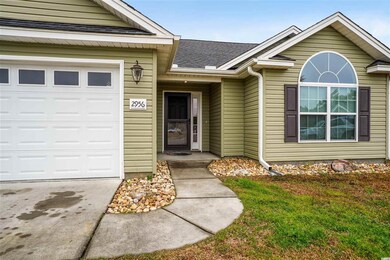
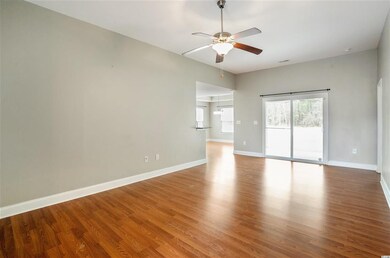
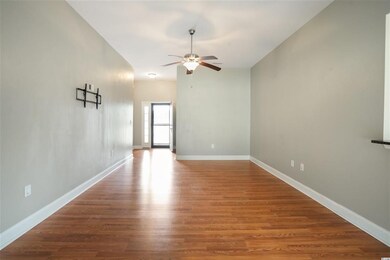
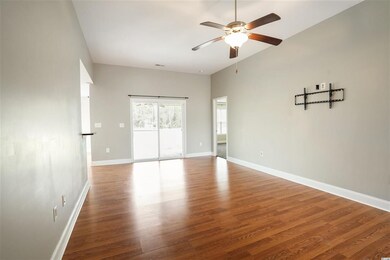
This home is located at 2956 Ivy Glen Dr, Conway, SC 29526 since 19 April 2021 and is currently priced at $260,396. This property was built in 2015. 2956 Ivy Glen Dr is a home located in Horry County with nearby schools including Homewood Elementary School, Whittemore Park Middle School, and Conway High School.
Last Agent to Rent the Property
MyBeach Vacation Rentals License #89340 Listed on: 04/19/2021
| Date | Buyer | Sale Price | Title Company |
|---|---|---|---|
| Equity Trust Company | $177,000 | -- | |
| North Stephen W | $139,900 | -- | |
| C & R Builders Llc | $20,000 | -- |
| Date | Status | Borrower | Loan Amount |
|---|---|---|---|
| Previous Owner | North Stephen W | $142,755 | |
| Previous Owner | C & R Builders Llc | $118,000 |
| Date | Event | Price | List to Sale | Price per Sq Ft | Prior Sale |
|---|---|---|---|---|---|
| 04/19/2021 04/19/21 | Rented | $1,500 | 0.0% | -- | |
| 04/19/2021 04/19/21 | For Rent | $1,500 | -99.2% | -- | |
| 04/17/2021 04/17/21 | Under Contract | -- | -- | -- | |
| 03/12/2021 03/12/21 | Sold | $177,000 | -1.6% | $124 / Sq Ft | View Prior Sale |
| 02/02/2021 02/02/21 | For Sale | $179,900 | -- | $126 / Sq Ft |
| Year | Tax Paid | Tax Assessment Tax Assessment Total Assessment is a certain percentage of the fair market value that is determined by local assessors to be the total taxable value of land and additions on the property. | Land | Improvement |
|---|---|---|---|---|
| 2024 | $4,144 | $15,548 | $3,900 | $11,648 |
| 2023 | $4,144 | $6,180 | $976 | $5,204 |
| 2021 | $3,823 | $16,224 | $2,563 | $13,661 |
| 2020 | $845 | $16,224 | $2,563 | $13,661 |
| 2019 | $845 | $16,224 | $2,563 | $13,661 |
| 2018 | $799 | $14,491 | $2,563 | $11,928 |
| 2017 | $799 | $12,904 | $976 | $11,928 |
| 2016 | -- | $12,904 | $976 | $11,928 |
| 2015 | $394 | $2,564 | $2,564 | $0 |
| 2014 | $381 | $1,465 | $1,465 | $0 |
Landlord's Agent in 2021
Laura Prichinello
MyBeach Vacation Rentals
(843) 631-7368
M
Seller's Agent in 2021
Michelle Autin
Sands Realty, LLC
Buyer's Agent in 2021
The Britt Page Group
Real Estate By The Sea
(843) 457-1919
9 in this area
310 Total Sales
Source: Coastal Carolinas Association of REALTORS®
MLS Number: 2108637
APN: 32511030020
Disclaimer: Certain information contained herein is derived from information provided by parties other than Homes.com. All information provided is deemed reliable, but is not guaranteed to be accurate and should be independently verified.
![]() Provided courtesy of the Coastal Carolinas MLS. Copyright 2025 of the Coastal Carolinas MLS. All rights reserved. Information is provided exclusively for consumers' personal, non-commercial use, and may not be used for any purpose other than to identify prospective properties consumers may be interested in purchasing, and that the data is deemed reliable but is not guaranteed accurate by the Coastal Carolinas MLS.
Provided courtesy of the Coastal Carolinas MLS. Copyright 2025 of the Coastal Carolinas MLS. All rights reserved. Information is provided exclusively for consumers' personal, non-commercial use, and may not be used for any purpose other than to identify prospective properties consumers may be interested in purchasing, and that the data is deemed reliable but is not guaranteed accurate by the Coastal Carolinas MLS.