Estimated Value: $201,000 - $251,000
3
Beds
2
Baths
1,690
Sq Ft
$137/Sq Ft
Est. Value
About This Home
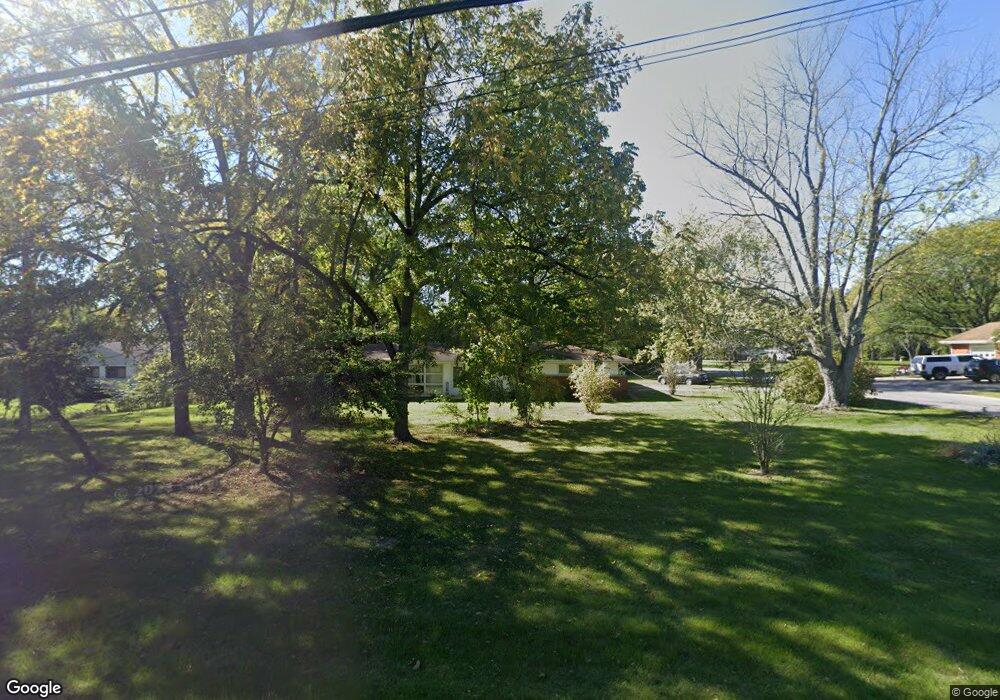
This home is located at 2956 Yoakam Rd, Lima, OH 45806 and is currently estimated at $231,502, approximately $136 per square foot. 2956 Yoakam Rd is a home located in Allen County with nearby schools including Maplewood Elementary School, Elmwood Elementary School, and Shawnee Middle School.
Ownership History
Date
Name
Owned For
Owner Type
Purchase Details
Closed on
Jul 23, 2021
Sold by
Diglio Joseph C and Diglio Joseph
Bought by
Diglio Joseph C and Diglio Crystal
Current Estimated Value
Purchase Details
Closed on
Feb 15, 2019
Sold by
Daley Carole L
Bought by
Diglio Joseph C
Purchase Details
Closed on
Sep 17, 2009
Sold by
Harden Pamela L
Bought by
Daley Carole L
Purchase Details
Closed on
Nov 13, 1997
Sold by
Mcconnell John
Bought by
Daley Carole and Daley Joseph
Home Financials for this Owner
Home Financials are based on the most recent Mortgage that was taken out on this home.
Original Mortgage
$71,656
Interest Rate
7.38%
Mortgage Type
New Conventional
Purchase Details
Closed on
Aug 31, 1990
Bought by
Gilford Joyce J
Create a Home Valuation Report for This Property
The Home Valuation Report is an in-depth analysis detailing your home's value as well as a comparison with similar homes in the area
Home Values in the Area
Average Home Value in this Area
Purchase History
| Date | Buyer | Sale Price | Title Company |
|---|---|---|---|
| Diglio Joseph C | -- | None Available | |
| Diglio Joseph C | $26,000 | None Available | |
| Daley Carole L | $15,000 | Attorney | |
| Daley Carole | $72,000 | -- | |
| Gilford Joyce J | -- | -- |
Source: Public Records
Mortgage History
| Date | Status | Borrower | Loan Amount |
|---|---|---|---|
| Previous Owner | Daley Carole | $71,656 |
Source: Public Records
Tax History
| Year | Tax Paid | Tax Assessment Tax Assessment Total Assessment is a certain percentage of the fair market value that is determined by local assessors to be the total taxable value of land and additions on the property. | Land | Improvement |
|---|---|---|---|---|
| 2024 | $2,530 | $50,300 | $11,830 | $38,470 |
| 2023 | $1,992 | $34,690 | $8,160 | $26,530 |
| 2022 | $2,021 | $34,690 | $8,160 | $26,530 |
| 2021 | $1,996 | $34,690 | $8,160 | $26,530 |
| 2020 | $976 | $28,850 | $7,880 | $20,970 |
| 2019 | $976 | $28,850 | $7,880 | $20,970 |
| 2018 | $992 | $28,850 | $7,880 | $20,970 |
| 2017 | $1,017 | $28,850 | $7,880 | $20,970 |
| 2016 | $1,041 | $28,850 | $7,880 | $20,970 |
| 2015 | $1,179 | $28,850 | $7,880 | $20,970 |
| 2014 | $1,179 | $32,310 | $7,560 | $24,750 |
| 2013 | $1,167 | $32,310 | $7,560 | $24,750 |
Source: Public Records
Map
Nearby Homes
- 2977 Pine Grove Way
- 2529 Struthmore Dr
- 4039 Magnolia
- 4211 Fort Amanda Rd
- 3039 Lakeshore Dr
- 2632 Alexandria Dr
- 3020 Lakeshore Dr
- 2905 Oak Hill Ct
- 4475 Wintergreen Dr
- 4268 Blue Spruce Ln
- 3220 Fort Amanda Rd
- 2160 Grimmwood Dr
- 3939 Odema Dr
- 115 Lanes End
- 3650 Redbud Ln
- 4190 Emma Pkwy
- 2975 Zurmehly Rd
- 2970 Sands Rd
- 3500 Weldon Dr
- 2852 Riverwalk Blvd Unit 2852
- 2970 Yoakam Rd
- 2944 Yoakam Rd
- 3105 Clement Dr
- 2957 Yoakam Rd
- 2990 Yoakam Rd
- 2969 Yoakam Rd
- 2918 Yoakam Rd
- 3106 Clement Dr
- 2939 Yoakam Rd
- 3172 Clement Dr
- 3172 Clement Dr
- 3109 Clement Dr
- 2977 Yoakam Rd
- 2800 Briargrove Ln
- 2826 Briargrove Ln
- 3793 N Amblewood Cir
- 2991 Yoakam Rd
- 3110 Clement Dr
- 2794 Briargrove Ln
Your Personal Tour Guide
Ask me questions while you tour the home.