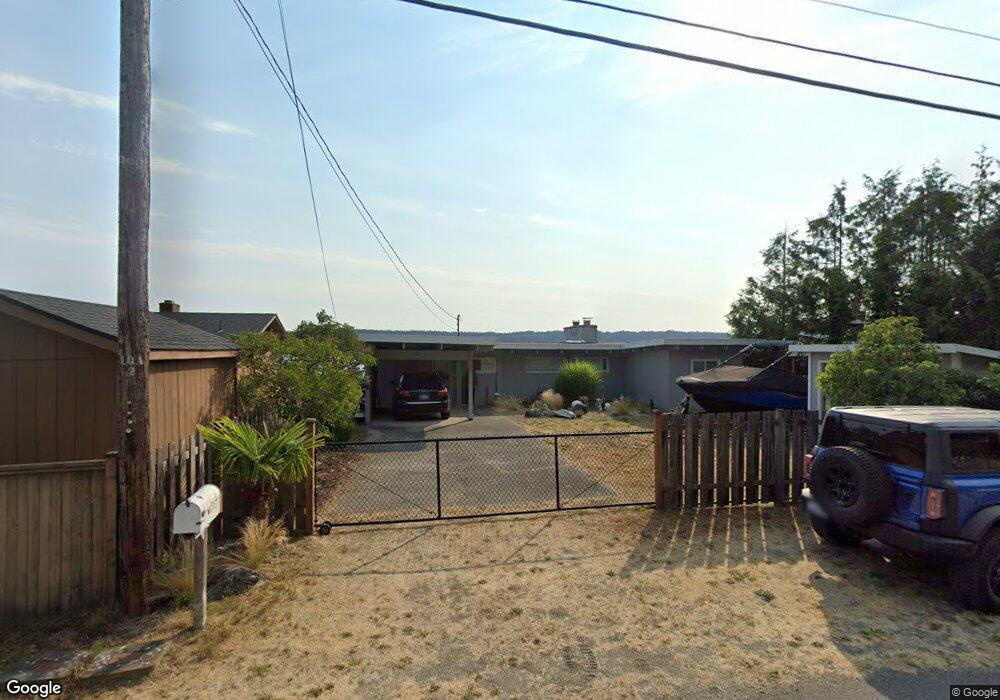
2957 S Tillicum Beach Dr Camano, WA 98282
Estimated Value: $777,000 - $1,145,000
2
Beds
1
Bath
954
Sq Ft
$1,074/Sq Ft
Est. Value
About This Home
This home is located at 2957 S Tillicum Beach Dr, Camano, WA 98282 and is currently estimated at $1,024,747, approximately $1,074 per square foot. 2957 S Tillicum Beach Dr is a home located in Island County with nearby schools including Elger Bay Elementary School, Stanwood Middle School, and Stanwood High School.
Ownership History
Date
Name
Owned For
Owner Type
Purchase Details
Closed on
Mar 15, 2017
Sold by
Jones Robert and Jones Paula
Bought by
Harder Michael and Howard Harder Heidi
Current Estimated Value
Home Financials for this Owner
Home Financials are based on the most recent Mortgage that was taken out on this home.
Original Mortgage
$447,920
Outstanding Balance
$371,439
Interest Rate
4.17%
Mortgage Type
New Conventional
Estimated Equity
$653,308
Purchase Details
Closed on
Jan 27, 2012
Sold by
Jones Robert
Bought by
Jones Robert and Jones Paula
Home Financials for this Owner
Home Financials are based on the most recent Mortgage that was taken out on this home.
Original Mortgage
$301,000
Interest Rate
3.85%
Mortgage Type
New Conventional
Purchase Details
Closed on
May 24, 2007
Sold by
Jones Howard V and Estate Of Vera May Santti
Bought by
Jones Robert P and Jones Gregory A
Create a Home Valuation Report for This Property
The Home Valuation Report is an in-depth analysis detailing your home's value as well as a comparison with similar homes in the area
Home Values in the Area
Average Home Value in this Area
Purchase History
| Date | Buyer | Sale Price | Title Company |
|---|---|---|---|
| Harder Michael | $559,900 | First American Title Ins Co | |
| Jones Robert | -- | First American Title Ins Co | |
| Jones Robert | $163,280 | First American Title Ins Co | |
| Jones Robert P | -- | None Available |
Source: Public Records
Mortgage History
| Date | Status | Borrower | Loan Amount |
|---|---|---|---|
| Open | Harder Michael | $447,920 | |
| Previous Owner | Jones Robert | $301,000 |
Source: Public Records
Tax History Compared to Growth
Tax History
| Year | Tax Paid | Tax Assessment Tax Assessment Total Assessment is a certain percentage of the fair market value that is determined by local assessors to be the total taxable value of land and additions on the property. | Land | Improvement |
|---|---|---|---|---|
| 2024 | $6,998 | $915,341 | $725,600 | $189,741 |
| 2023 | $6,998 | $917,677 | $725,600 | $192,077 |
| 2022 | $6,360 | $876,647 | $700,600 | $176,047 |
| 2021 | $5,583 | $689,818 | $550,600 | $139,218 |
| 2020 | $5,751 | $585,979 | $450,600 | $135,379 |
| 2019 | $5,738 | $596,321 | $500,600 | $95,721 |
| 2018 | $4,959 | $596,608 | $500,600 | $96,008 |
| 2017 | $3,657 | $477,183 | $380,600 | $96,583 |
| 2016 | $3,374 | $390,455 | $320,600 | $69,855 |
| 2015 | $3,461 | $346,124 | $300,600 | $45,524 |
| 2013 | -- | $348,139 | $300,600 | $47,539 |
Source: Public Records
Map
Nearby Homes
- 2957 Tillicum Beach Dr
- 3019 Sauk Dr
- 3088 Galena Dr
- 1357 Steffen Place
- 2100 S Camano Dr
- 27 xx S Camano Dr
- 3145 Redwing Rd
- 3030 S Mabana Heights Rd
- 2802 S Park Dr
- 2681 S East Camano Island Dr
- 3425 Rose Ln
- 0 S Camano Dr Unit NWM2223825
- 2650 S East Camano Dr
- 2801 Huckleberry Ln
- 3445 SE Camano Dr
- 2527 Bretland Rd
- 4200 S Camano Dr
- 2515 Bretland Rd
- 2459 Bretland Rd
- 1804 3700 S
- 2953 Tillicum Beach Dr
- 2959 Tillicum Beach Dr
- 2949 Tillicum Beach Dr
- 2963 Tillicum Beach Dr
- 2958 Tillicum Beach Dr
- 2956 Tillicum Beach Dr
- 2966 Tillicum Beach Dr
- 2962 Tillicum Beach Dr
- 2967 Tillicum Beach Dr
- 2952 Tillicum Beach Dr
- 2971 Tillicum Beach Dr
- 2968 Tillicum Beach Dr
- 2945 Tillicum Beach Dr
- 2975 Tillicum Beach Dr
- 2974 Tillicum Beach Dr
- 2979 Tillicum Beach Dr
- 2942 Tillicum Beach Dr
- 2983 Tillicum Beach Dr
- 2937 Tillicum Beach Dr
- 2987 Tillicum Beach Dr