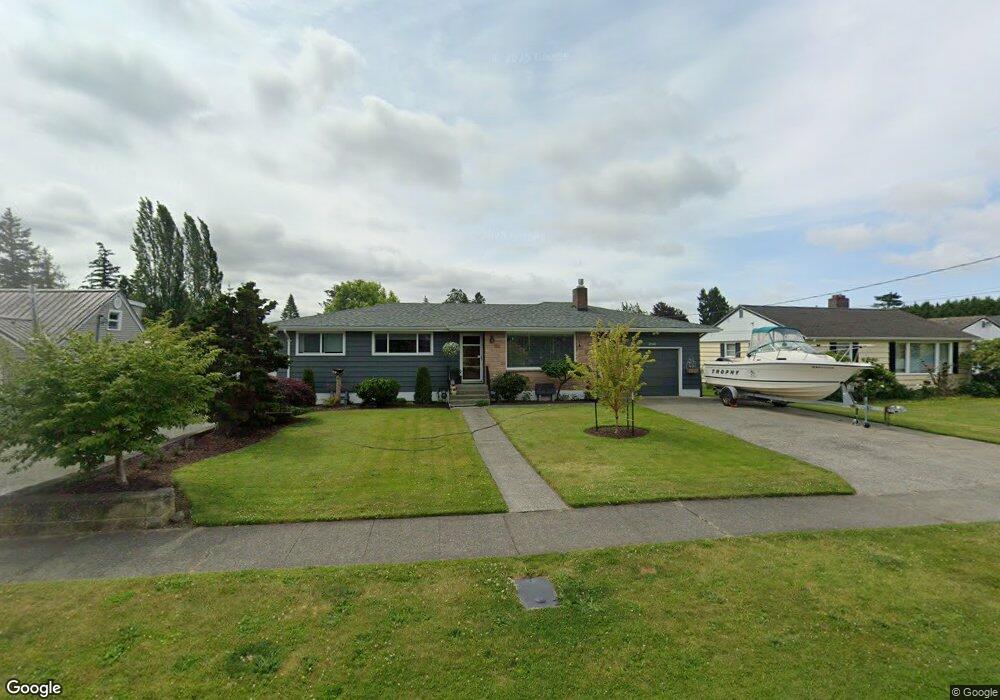
2958 Plymouth Dr Bellingham, WA 98225
Cornwall Park NeighborhoodEstimated Value: $605,000 - $833,371
4
Beds
2
Baths
1,939
Sq Ft
$381/Sq Ft
Est. Value
About This Home
This home is located at 2958 Plymouth Dr, Bellingham, WA 98225 and is currently estimated at $738,093, approximately $380 per square foot. 2958 Plymouth Dr is a home located in Whatcom County with nearby schools including Parkview Elementary School, Whatcom Middle School, and Bellingham High School.
Ownership History
Date
Name
Owned For
Owner Type
Purchase Details
Closed on
Feb 4, 2000
Sold by
Felicetta James V and Fuller Gail A
Bought by
Magnuson Paul W and Magnuson Kristina G
Current Estimated Value
Home Financials for this Owner
Home Financials are based on the most recent Mortgage that was taken out on this home.
Original Mortgage
$131,200
Outstanding Balance
$43,308
Interest Rate
8.14%
Estimated Equity
$694,785
Create a Home Valuation Report for This Property
The Home Valuation Report is an in-depth analysis detailing your home's value as well as a comparison with similar homes in the area
Home Values in the Area
Average Home Value in this Area
Purchase History
| Date | Buyer | Sale Price | Title Company |
|---|---|---|---|
| Magnuson Paul W | $164,000 | Charter Title Corporation |
Source: Public Records
Mortgage History
| Date | Status | Borrower | Loan Amount |
|---|---|---|---|
| Open | Magnuson Paul W | $131,200 | |
| Closed | Magnuson Paul W | $16,400 |
Source: Public Records
Tax History Compared to Growth
Tax History
| Year | Tax Paid | Tax Assessment Tax Assessment Total Assessment is a certain percentage of the fair market value that is determined by local assessors to be the total taxable value of land and additions on the property. | Land | Improvement |
|---|---|---|---|---|
| 2024 | $5,977 | $749,037 | $338,668 | $410,369 |
| 2023 | $5,977 | $768,062 | $347,270 | $420,792 |
| 2022 | $4,881 | $662,134 | $299,376 | $362,758 |
| 2021 | $4,789 | $525,503 | $237,600 | $287,903 |
| 2020 | $4,896 | $486,577 | $220,000 | $266,577 |
| 2019 | $4,383 | $480,809 | $224,600 | $256,209 |
| 2018 | $4,414 | $431,605 | $201,650 | $229,955 |
| 2017 | $3,805 | $371,597 | $173,610 | $197,987 |
| 2016 | $3,331 | $334,781 | $155,790 | $178,991 |
| 2015 | $3,266 | $305,066 | $142,290 | $162,776 |
| 2014 | -- | $289,436 | $135,000 | $154,436 |
| 2013 | -- | $269,775 | $120,750 | $149,025 |
Source: Public Records
Map
Nearby Homes
- 2966 Plymouth Dr
- 2954 Plymouth Dr
- 2972 Plymouth Dr
- 2950 Plymouth Dr
- 2978 Plymouth Dr
- 2942 Plymouth Dr
- 2945 Sunset Dr
- 2939 Sunset Dr
- 2949 Plymouth Dr
- 2949 Sunset Dr
- 2935 Sunset Dr
- 2984 Plymouth Dr
- 2945 Plymouth Dr
- 2961 Plymouth Dr
- 2953 Sunset Dr
- 2959 Plymouth Dr
- 2936 Plymouth Dr
- 2965 Plymouth Dr
- 2933 Sunset Dr
- 2969 Plymouth Dr