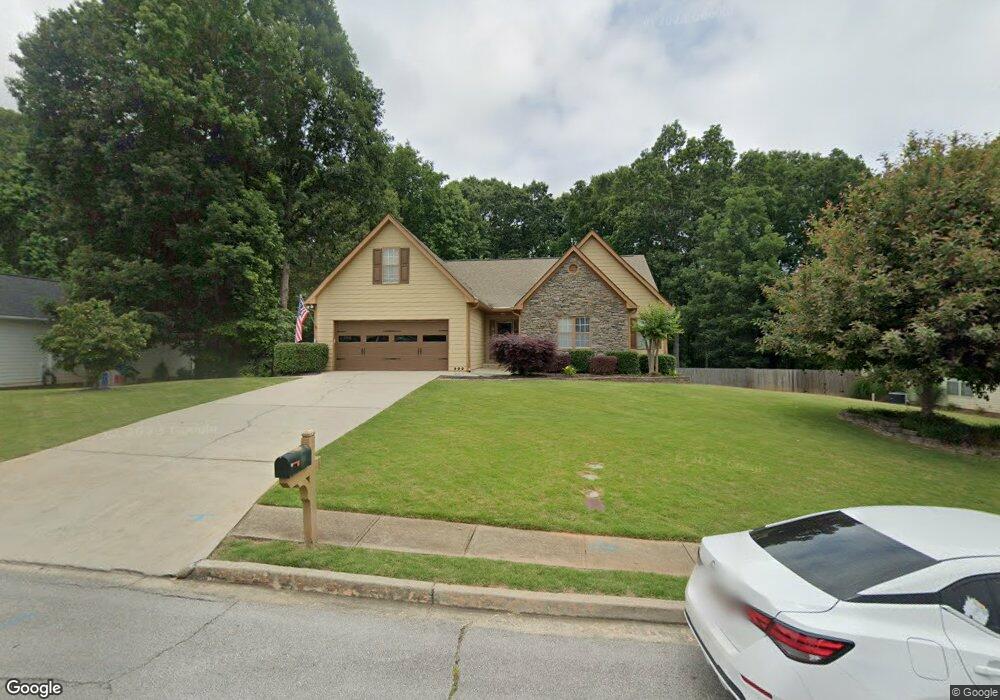
2958 Sardis Mill Trail Unit 2 Buford, GA 30519
Estimated Value: $405,000 - $446,000
4
Beds
3
Baths
2,154
Sq Ft
$198/Sq Ft
Est. Value
About This Home
This home is located at 2958 Sardis Mill Trail Unit 2, Buford, GA 30519 and is currently estimated at $426,155, approximately $197 per square foot. 2958 Sardis Mill Trail Unit 2 is a home located in Gwinnett County with nearby schools including Ivy Creek Elementary School and Glenn C. Jones Middle School.
Ownership History
Date
Name
Owned For
Owner Type
Purchase Details
Closed on
Jan 15, 2015
Sold by
Dingfelder Rossana M
Bought by
Dingfelder Scott E
Current Estimated Value
Purchase Details
Closed on
Feb 2, 2000
Sold by
Jaunais Kenneth and Jaunais Barbara G
Bought by
Dingfelder Scott E and Dingfelder Rossana M
Home Financials for this Owner
Home Financials are based on the most recent Mortgage that was taken out on this home.
Original Mortgage
$130,000
Interest Rate
7.5%
Mortgage Type
New Conventional
Purchase Details
Closed on
Feb 26, 1999
Sold by
Constr Constr and Constr S
Bought by
Jaunais Kenneth and Jaunais Barbara G
Home Financials for this Owner
Home Financials are based on the most recent Mortgage that was taken out on this home.
Original Mortgage
$163,800
Interest Rate
6.74%
Mortgage Type
VA
Create a Home Valuation Report for This Property
The Home Valuation Report is an in-depth analysis detailing your home's value as well as a comparison with similar homes in the area
Home Values in the Area
Average Home Value in this Area
Purchase History
| Date | Buyer | Sale Price | Title Company |
|---|---|---|---|
| Dingfelder Scott E | -- | -- | |
| Dingfelder Scott E | $174,000 | -- | |
| Jaunais Kenneth | $159,100 | -- |
Source: Public Records
Mortgage History
| Date | Status | Borrower | Loan Amount |
|---|---|---|---|
| Previous Owner | Dingfelder Scott E | $130,000 | |
| Previous Owner | Jaunais Kenneth | $163,800 |
Source: Public Records
Tax History Compared to Growth
Tax History
| Year | Tax Paid | Tax Assessment Tax Assessment Total Assessment is a certain percentage of the fair market value that is determined by local assessors to be the total taxable value of land and additions on the property. | Land | Improvement |
|---|---|---|---|---|
| 2025 | $4,744 | $187,120 | $32,800 | $154,320 |
| 2024 | $4,651 | $175,080 | $30,400 | $144,680 |
| 2023 | $4,651 | $175,080 | $30,400 | $144,680 |
| 2022 | $3,357 | $114,000 | $20,720 | $93,280 |
| 2021 | $3,410 | $114,000 | $20,720 | $93,280 |
| 2020 | $3,436 | $121,400 | $20,720 | $100,680 |
| 2019 | $3,302 | $111,120 | $17,920 | $93,200 |
| 2018 | $2,600 | $78,640 | $14,400 | $64,240 |
| 2016 | $2,625 | $78,640 | $14,400 | $64,240 |
| 2015 | $2,601 | $76,720 | $12,000 | $64,720 |
| 2014 | -- | $60,760 | $13,200 | $47,560 |
Source: Public Records
Map
Nearby Homes
- 4162 Wyndham Ridge Ct Unit 3
- 3475 Duncan Bridge Dr Unit 2
- 4602 Shay Terrace
- 2726 Talley Ln
- 2740 Talley Ln
- 2724 Talley Ln
- 2415 Hamilton Parc Ln
- 2200 Spring Sound Ln
- 2485 Hamilton Parc Ln
- 2171 Spring Sound Ln
- 4292 Sardis Church Rd
- 2590 Hamilton Parc Ln
- 2206 Spring Stone Ct
- 4082 Adler Cir Unit 35
- 4082 Adler Cir
- 3941 Adler Cir
- 2424 Pinnae Place
- 4012 Adler Cir
- 2968 Sardis Mill Trail
- 2948 Sardis Mill Trail
- 2938 Sardis Mill Trail
- 2978 Sardis Mill Trail
- 2941 Sardis Mill Trail Unit 2
- 2961 Sardis Mill Trail
- 3960 Lenox Park Dr
- 2928 Sardis Mill Trail Unit 1
- 2988 Sardis Mill Trail Unit 2
- 2822 Sardis Mill Ct Unit 2
- 2931 Sardis Mill Trail
- 2971 Sardis Mill Trail
- 2827 Sardis Mill Ct
- 3970 Lenox Park Dr
- 2918 Sardis Mill Trail
- 2921 Sardis Mill Trail
- 4152 Wyndham Ridge Ct
- 2812 Sardis Mill Ct
- 4162 Wyndham Ridge Ct NE
- 2881 Sardis Mill Trail