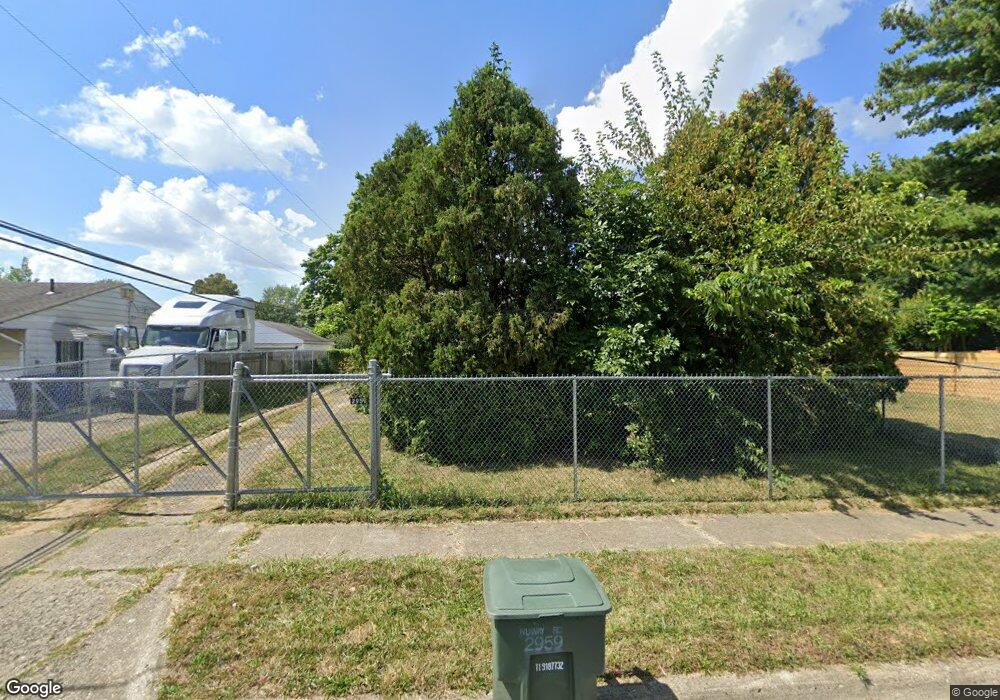
2959 Nuway Rd Columbus, OH 43207
Marion Franklin NeighborhoodEstimated Value: $161,000 - $181,000
3
Beds
1
Bath
896
Sq Ft
$188/Sq Ft
Est. Value
About This Home
This home is located at 2959 Nuway Rd, Columbus, OH 43207 and is currently estimated at $168,019, approximately $187 per square foot. 2959 Nuway Rd is a home located in Franklin County with nearby schools including Watkins Elementary School, Buckeye Middle School, and Marion-Franklin High School.
Ownership History
Date
Name
Owned For
Owner Type
Purchase Details
Closed on
Oct 1, 1986
Current Estimated Value
Create a Home Valuation Report for This Property
The Home Valuation Report is an in-depth analysis detailing your home's value as well as a comparison with similar homes in the area
Home Values in the Area
Average Home Value in this Area
Purchase History
| Date | Buyer | Sale Price | Title Company |
|---|---|---|---|
| -- | -- | -- |
Source: Public Records
Tax History
| Year | Tax Paid | Tax Assessment Tax Assessment Total Assessment is a certain percentage of the fair market value that is determined by local assessors to be the total taxable value of land and additions on the property. | Land | Improvement |
|---|---|---|---|---|
| 2025 | $3,507 | $38,230 | $12,220 | $26,010 |
| 2024 | $3,507 | $38,230 | $12,220 | $26,010 |
| 2023 | $1,694 | $38,220 | $12,215 | $26,005 |
| 2022 | $1,082 | $20,870 | $8,860 | $12,010 |
| 2021 | $1,084 | $20,870 | $8,860 | $12,010 |
| 2020 | $1,086 | $20,870 | $8,860 | $12,010 |
| 2019 | $1,066 | $17,570 | $7,700 | $9,870 |
| 2018 | $1,047 | $17,570 | $7,700 | $9,870 |
| 2017 | $1,065 | $17,570 | $7,700 | $9,870 |
| 2016 | $1,134 | $17,120 | $3,960 | $13,160 |
| 2015 | $1,029 | $17,120 | $3,960 | $13,160 |
| 2014 | $1,032 | $17,120 | $3,960 | $13,160 |
| 2013 | $536 | $18,025 | $4,165 | $13,860 |
Source: Public Records
Map
Nearby Homes
- 3018 Woodway Rd
- 1249 Evergreen Rd
- 3060 Durham Dr
- 1450 Felix Dr
- 3067 Huntington Dr
- 2666 Arcola Rd
- 2685 Bulen Ave
- 2626 Diane Place
- 1433 Venice Dr
- 3172 Weirton Dr
- 1299 Yolanda Dr
- 1138 Hilock Rd Unit 35
- 2441 Wilson Ave
- 884 Bruckner Rd
- 868 Koebel Ave
- 3551 Groveport Rd
- 868 Lawndale Ave
- 1124 Rumsey Rd
- 3251 Hilock Ct
- 818 Lawndale Ave
- 2963 Nuway Rd
- 1321 Watkins Rd
- 1313 Watkins Rd
- 2971 Nuway Rd
- 1312 Grovewood Dr
- 1307 Watkins Rd
- 1304 Grovewood Dr
- 2960 Nuway Rd
- 2966 Nuway Rd
- 2952 Nuway Rd
- 1299 Watkins Rd
- 2974 Nuway Rd
- 1298 Grovewood Dr
- 1324 Watkins Rd
- 2985 Nuway Rd
- 0 Watkins Rd
- 1293 Watkins Rd
- 1290 Grovewood Dr
- 1359 Watkins Rd
- 2930 Nuway Rd
Your Personal Tour Guide
Ask me questions while you tour the home.