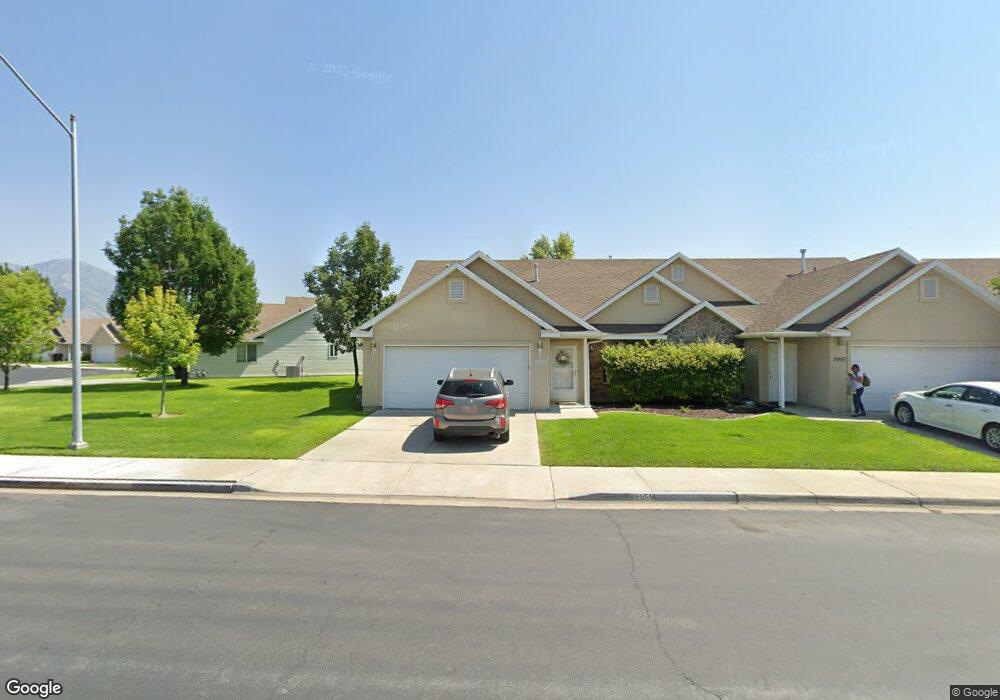
2959 W 1130 N Provo, UT 84601
Lakeview NeighborhoodEstimated Value: $378,000 - $459,000
3
Beds
2
Baths
1,340
Sq Ft
$303/Sq Ft
Est. Value
About This Home
This home is located at 2959 W 1130 N, Provo, UT 84601 and is currently estimated at $405,863, approximately $302 per square foot. 2959 W 1130 N is a home located in Utah County with nearby schools including Lakeview School, Dixon Middle School, and Provo High School.
Ownership History
Date
Name
Owned For
Owner Type
Purchase Details
Closed on
Jun 5, 2018
Sold by
Dixon Glen Bnergstrom
Bought by
Dixon Glen Bergstrom and Dixon Family Trust
Current Estimated Value
Purchase Details
Closed on
Jul 20, 2011
Sold by
Chapman Bertha E
Bought by
Dixon Dwight R
Home Financials for this Owner
Home Financials are based on the most recent Mortgage that was taken out on this home.
Original Mortgage
$139,840
Outstanding Balance
$95,978
Interest Rate
4.46%
Mortgage Type
New Conventional
Estimated Equity
$309,885
Purchase Details
Closed on
Apr 2, 2001
Sold by
Belvedere John
Bought by
Chapman Harry D and Chapman Bertha E
Home Financials for this Owner
Home Financials are based on the most recent Mortgage that was taken out on this home.
Original Mortgage
$103,900
Interest Rate
7.06%
Create a Home Valuation Report for This Property
The Home Valuation Report is an in-depth analysis detailing your home's value as well as a comparison with similar homes in the area
Home Values in the Area
Average Home Value in this Area
Purchase History
| Date | Buyer | Sale Price | Title Company |
|---|---|---|---|
| Dixon Glen Bergstrom | -- | Provo Abstract Co Inc | |
| Dixon Dwight R | -- | Equity Title Orem Center St | |
| Chapman Harry D | -- | Empire Land Title Company |
Source: Public Records
Mortgage History
| Date | Status | Borrower | Loan Amount |
|---|---|---|---|
| Open | Dixon Dwight R | $139,840 | |
| Previous Owner | Chapman Harry D | $103,900 |
Source: Public Records
Tax History Compared to Growth
Tax History
| Year | Tax Paid | Tax Assessment Tax Assessment Total Assessment is a certain percentage of the fair market value that is determined by local assessors to be the total taxable value of land and additions on the property. | Land | Improvement |
|---|---|---|---|---|
| 2025 | $492 | $209,165 | $73,800 | $306,500 |
| 2024 | $492 | $197,120 | $0 | $0 |
| 2023 | $1,997 | $193,820 | $0 | $0 |
| 2022 | $1,924 | $188,210 | $0 | $0 |
| 2021 | $1,531 | $261,200 | $75,000 | $186,200 |
| 2020 | $1,526 | $244,100 | $75,000 | $169,100 |
| 2019 | $1,443 | $240,000 | $75,000 | $165,000 |
| 2018 | $1,397 | $235,700 | $75,000 | $160,700 |
| 2017 | $1,143 | $105,985 | $0 | $0 |
| 2016 | $1,093 | $94,435 | $0 | $0 |
| 2015 | $1,039 | $90,750 | $0 | $0 |
| 2014 | $906 | $82,500 | $0 | $0 |
Source: Public Records
Map
Nearby Homes
- 2967 W 1130 N
- 2941 W 1100 N
- 2975 W 1130 N
- 2933 W 1100 N
- 2983 W 1130 N
- 2968 W 1130 N
- 2952 W 1060 N
- 2952 W 1130 N
- 2952 W 1130 N Unit 36
- 2974 W 1130 N
- 2917 W 1100 N
- 2976 W 1060 N
- 2934 W 1060 N
- 2944 W 1130 N
- 2911 W 1100 N
- 1145 N 2960 W
- 1145 N 2960 W Unit 44
- 2908 W 1060 N
- 1154 N 2960 W
- 1154 N 2960 W Unit 37