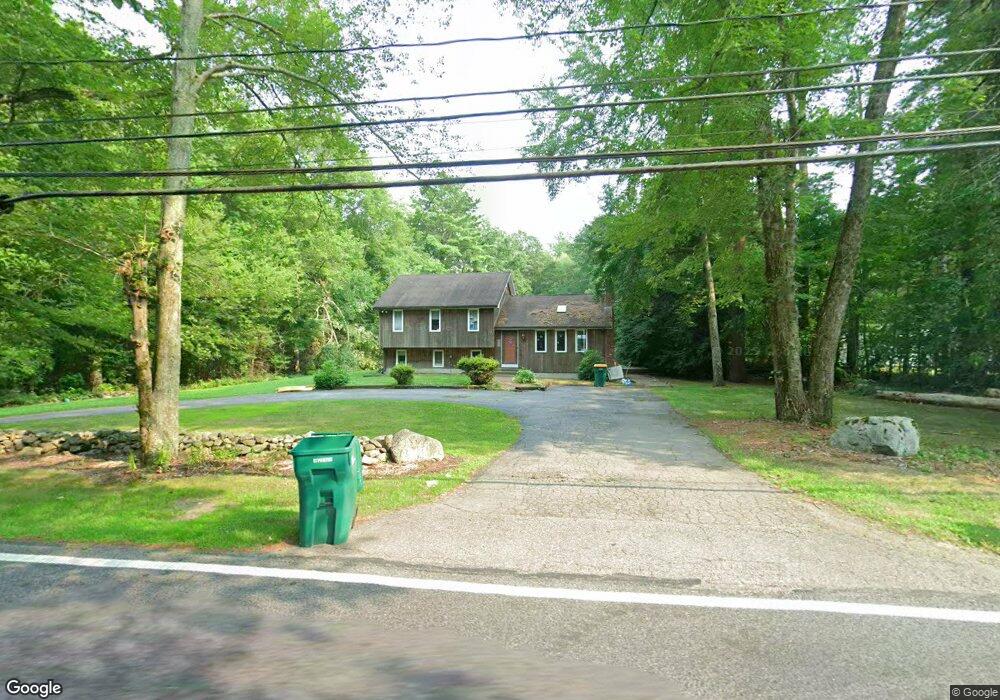
296 Balcom St Mansfield, MA 02048
Estimated Value: $647,179 - $988,000
3
Beds
2
Baths
1,806
Sq Ft
$438/Sq Ft
Est. Value
About This Home
This home is located at 296 Balcom St, Mansfield, MA 02048 and is currently estimated at $790,795, approximately $437 per square foot. 296 Balcom St is a home located in Bristol County with nearby schools including Everett W. Robinson Elementary School, Jordan/Jackson Elementary School, and Harold L. Qualters Middle School.
Ownership History
Date
Name
Owned For
Owner Type
Purchase Details
Closed on
Jun 17, 2010
Sold by
Staley Anthony
Bought by
Huftalen Stephen R and Huftalen Tarsha M
Current Estimated Value
Home Financials for this Owner
Home Financials are based on the most recent Mortgage that was taken out on this home.
Original Mortgage
$351,515
Outstanding Balance
$232,644
Interest Rate
5.03%
Mortgage Type
Purchase Money Mortgage
Estimated Equity
$558,151
Purchase Details
Closed on
Aug 2, 2004
Sold by
Kinahan-Newell Kathleen T and Newell Mark
Bought by
Staley Anthony J
Home Financials for this Owner
Home Financials are based on the most recent Mortgage that was taken out on this home.
Original Mortgage
$278,400
Interest Rate
6.33%
Mortgage Type
Purchase Money Mortgage
Purchase Details
Closed on
Oct 31, 2001
Sold by
Joseph George
Bought by
Newell Mark A and Newell Kinahan-Newell K
Home Financials for this Owner
Home Financials are based on the most recent Mortgage that was taken out on this home.
Original Mortgage
$250,800
Interest Rate
6.82%
Mortgage Type
Purchase Money Mortgage
Purchase Details
Closed on
Aug 1, 1991
Sold by
Maynard Roland J
Bought by
Joseph 3D George
Home Financials for this Owner
Home Financials are based on the most recent Mortgage that was taken out on this home.
Original Mortgage
$133,000
Interest Rate
9.58%
Mortgage Type
Purchase Money Mortgage
Create a Home Valuation Report for This Property
The Home Valuation Report is an in-depth analysis detailing your home's value as well as a comparison with similar homes in the area
Home Values in the Area
Average Home Value in this Area
Purchase History
| Date | Buyer | Sale Price | Title Company |
|---|---|---|---|
| Huftalen Stephen R | $358,000 | -- | |
| Staley Anthony J | $348,000 | -- | |
| Newell Mark A | $261,000 | -- | |
| Joseph 3D George | $148,000 | -- |
Source: Public Records
Mortgage History
| Date | Status | Borrower | Loan Amount |
|---|---|---|---|
| Open | Huftalen Stephen R | $351,515 | |
| Previous Owner | Staley Anthony J | $278,400 | |
| Previous Owner | Joseph 3D George | $250,800 | |
| Previous Owner | Joseph 3D George | $131,000 | |
| Previous Owner | Joseph 3D George | $133,000 |
Source: Public Records
Tax History
| Year | Tax Paid | Tax Assessment Tax Assessment Total Assessment is a certain percentage of the fair market value that is determined by local assessors to be the total taxable value of land and additions on the property. | Land | Improvement |
|---|---|---|---|---|
| 2025 | $7,787 | $591,300 | $252,600 | $338,700 |
| 2024 | $7,555 | $559,600 | $252,600 | $307,000 |
| 2023 | $7,404 | $525,500 | $252,600 | $272,900 |
| 2022 | $7,154 | $471,600 | $233,900 | $237,700 |
| 2021 | $6,395 | $445,500 | $204,600 | $240,900 |
| 2020 | $6,207 | $406,400 | $194,900 | $211,500 |
| 2019 | $5,831 | $383,100 | $162,300 | $220,800 |
| 2018 | $5,626 | $359,000 | $154,900 | $204,100 |
| 2017 | $5,316 | $354,700 | $150,600 | $204,100 |
| 2016 | $5,323 | $345,400 | $143,200 | $202,200 |
| 2015 | $4,921 | $317,500 | $143,200 | $174,300 |
Source: Public Records
Map
Nearby Homes
Your Personal Tour Guide
Ask me questions while you tour the home.