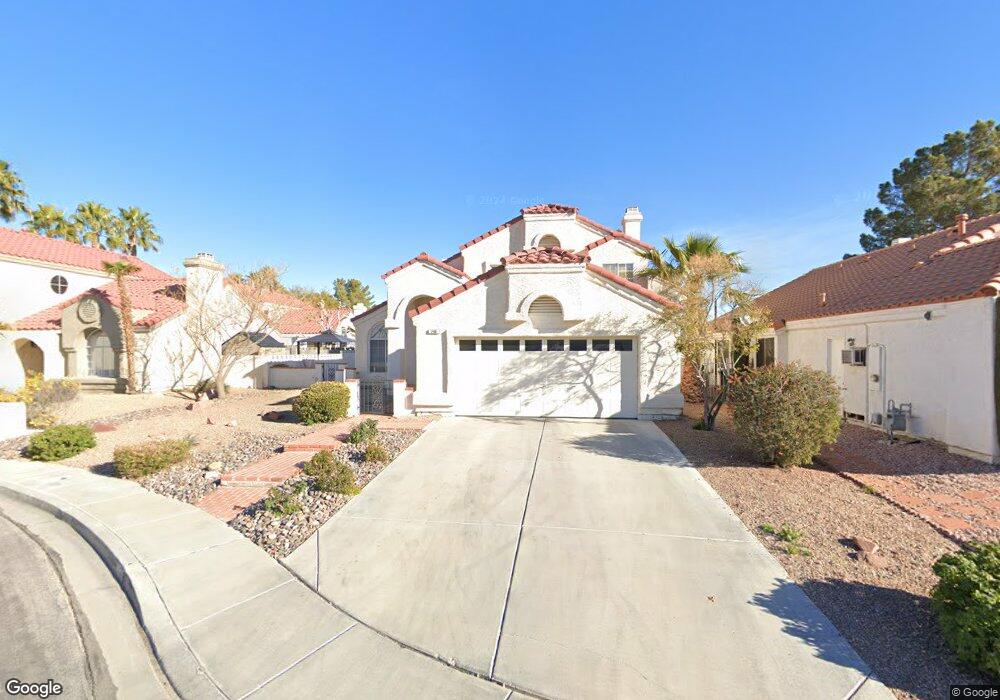
296 Davis Hill Ct Unit 2 Henderson, NV 89074
Green Valley North NeighborhoodEstimated Value: $475,000 - $509,000
3
Beds
3
Baths
1,925
Sq Ft
$255/Sq Ft
Est. Value
About This Home
This home is located at 296 Davis Hill Ct Unit 2, Henderson, NV 89074 and is currently estimated at $491,443, approximately $255 per square foot. 296 Davis Hill Ct Unit 2 is a home located in Clark County with nearby schools including James Gibson Elementary School, Barbara and Hank Greenspun Junior High School, and Green Valley High School.
Ownership History
Date
Name
Owned For
Owner Type
Purchase Details
Closed on
Jun 2, 2018
Sold by
Ma Michael W and Chung Amy H
Bought by
Chung Amy H
Current Estimated Value
Purchase Details
Closed on
Mar 23, 2011
Sold by
Fannie Mae
Bought by
Ma Michael W and Chung Amy H
Purchase Details
Closed on
Jul 16, 2010
Sold by
Kimber Jeffrey
Bought by
Federal National Mortgage Association
Purchase Details
Closed on
Aug 8, 2001
Sold by
Taylor Scott O and Taylor Paula C
Bought by
Kimber Jeffrey
Home Financials for this Owner
Home Financials are based on the most recent Mortgage that was taken out on this home.
Original Mortgage
$184,250
Interest Rate
7.09%
Purchase Details
Closed on
Jul 26, 2000
Sold by
Reina Ben and Reina Margaret
Bought by
Taylor Scott O and Taylor Paula C
Home Financials for this Owner
Home Financials are based on the most recent Mortgage that was taken out on this home.
Original Mortgage
$156,650
Interest Rate
8.2%
Create a Home Valuation Report for This Property
The Home Valuation Report is an in-depth analysis detailing your home's value as well as a comparison with similar homes in the area
Home Values in the Area
Average Home Value in this Area
Purchase History
| Date | Buyer | Sale Price | Title Company |
|---|---|---|---|
| Chung Amy H | -- | None Available | |
| Ma Michael W | $130,000 | Stewart Title Of Nevada | |
| Federal National Mortgage Association | $288,793 | Accommodation | |
| Kimber Jeffrey | $189,950 | Fidelity National Title | |
| Taylor Scott O | $164,900 | United Title |
Source: Public Records
Mortgage History
| Date | Status | Borrower | Loan Amount |
|---|---|---|---|
| Previous Owner | Kimber Jeffrey | $184,250 | |
| Previous Owner | Taylor Scott O | $156,650 |
Source: Public Records
Tax History Compared to Growth
Tax History
| Year | Tax Paid | Tax Assessment Tax Assessment Total Assessment is a certain percentage of the fair market value that is determined by local assessors to be the total taxable value of land and additions on the property. | Land | Improvement |
|---|---|---|---|---|
| 2025 | $2,354 | $96,037 | $39,900 | $56,137 |
| 2024 | $2,180 | $96,037 | $39,900 | $56,137 |
| 2023 | $2,180 | $89,046 | $35,000 | $54,046 |
| 2022 | $2,019 | $80,426 | $30,660 | $49,766 |
| 2021 | $1,870 | $75,738 | $28,000 | $47,738 |
| 2020 | $1,733 | $74,862 | $27,300 | $47,562 |
| 2019 | $1,624 | $70,975 | $23,800 | $47,175 |
| 2018 | $1,550 | $65,887 | $20,300 | $45,587 |
| 2017 | $1,916 | $66,105 | $19,600 | $46,505 |
| 2016 | $1,451 | $59,952 | $12,950 | $47,002 |
| 2015 | $1,448 | $56,654 | $10,500 | $46,154 |
| 2014 | $1,403 | $46,986 | $10,325 | $36,661 |
Source: Public Records
Map
Nearby Homes
- 272 Grand Teton Dr
- 1939 Guinn Dr
- 2108 Running River Rd
- 259 Spring Hills Ln
- 1926 Navarre Ln
- 346 Pinnacle Ct
- 347 Gana Ct Unit B
- 372 Rushing Creek Ct
- 322 Oliveiro Ct
- 231 Windsong Dr
- 1832 Muchacha Dr
- 371 Legacy Dr
- 1831 Escondido Terrace
- 1952 Barranca Dr
- 2246 Cassatt Dr
- 1810 Nuevo Rd
- 2250 Cassatt Dr
- 2021 Angel Falls Dr
- 327 Fuente Dr
- 310 Pissarro Place
- 294 Davis Hill Ct
- 298 Davis Hill Ct
- 295 Cameron Hill Ct
- 293 Cameron Hill Ct
- 292 Davis Hill Ct Unit 2
- 297 Cameron Hill Ct
- 291 Cameron Hill Ct
- 278 Grand Teton Dr Unit II
- 276 Grand Teton Dr
- 280 Grand Teton Dr
- 295 Davis Hill Ct
- 297 Davis Hill Ct Unit 2
- 289 Cameron Hill Ct
- 290 Davis Hill Ct
- 274 Grand Teton Dr
- 293 Davis Hill Ct
- 282 Grand Teton Dr Unit II
- 1942 Guinn Dr Unit 2
- 284 Grand Teton Dr
- 287 Cameron Hill Ct