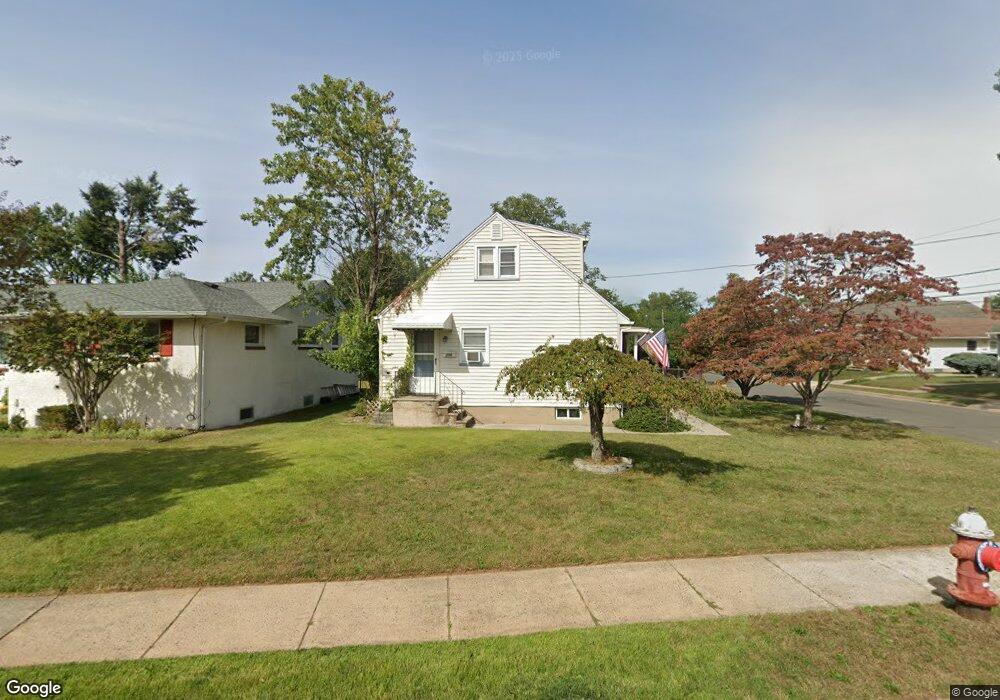
296 Fulton St Middlesex, NJ 08846
Estimated Value: $414,598 - $520,000
--
Bed
--
Bath
--
Sq Ft
5,227
Sq Ft Lot
About This Home
This home is located at 296 Fulton St, Middlesex, NJ 08846 and is currently estimated at $471,650. 296 Fulton St is a home located in Middlesex County with nearby schools including Middlesex High School and Our Lady of Mount Virgin School.
Ownership History
Date
Name
Owned For
Owner Type
Purchase Details
Closed on
Apr 5, 2007
Sold by
Dattoli Todd
Bought by
Lawther Sheila
Current Estimated Value
Home Financials for this Owner
Home Financials are based on the most recent Mortgage that was taken out on this home.
Original Mortgage
$250,000
Outstanding Balance
$151,489
Interest Rate
6.19%
Estimated Equity
$320,161
Purchase Details
Closed on
Jun 14, 2002
Sold by
Green Robert
Bought by
Jaworski Denise
Home Financials for this Owner
Home Financials are based on the most recent Mortgage that was taken out on this home.
Original Mortgage
$189,000
Interest Rate
6.79%
Create a Home Valuation Report for This Property
The Home Valuation Report is an in-depth analysis detailing your home's value as well as a comparison with similar homes in the area
Home Values in the Area
Average Home Value in this Area
Purchase History
| Date | Buyer | Sale Price | Title Company |
|---|---|---|---|
| Lawther Sheila | $324,900 | -- | |
| Jaworski Denise | $210,000 | -- |
Source: Public Records
Mortgage History
| Date | Status | Borrower | Loan Amount |
|---|---|---|---|
| Open | Lawther Sheila | $250,000 | |
| Previous Owner | Jaworski Denise | $189,000 |
Source: Public Records
Tax History Compared to Growth
Tax History
| Year | Tax Paid | Tax Assessment Tax Assessment Total Assessment is a certain percentage of the fair market value that is determined by local assessors to be the total taxable value of land and additions on the property. | Land | Improvement |
|---|---|---|---|---|
| 2025 | $8,080 | $420,500 | $122,400 | $298,100 |
| 2024 | $7,693 | $349,200 | $122,400 | $226,800 |
| 2023 | $7,693 | $349,200 | $122,400 | $226,800 |
| 2022 | $7,755 | $78,400 | $26,000 | $52,400 |
| 2021 | $5,294 | $78,400 | $26,000 | $52,400 |
| 2020 | $7,387 | $78,400 | $26,000 | $52,400 |
| 2019 | $7,187 | $78,400 | $26,000 | $52,400 |
| 2018 | $6,969 | $78,400 | $26,000 | $52,400 |
| 2017 | $6,777 | $78,400 | $26,000 | $52,400 |
| 2016 | $6,553 | $78,400 | $26,000 | $52,400 |
| 2015 | $6,415 | $78,400 | $26,000 | $52,400 |
| 2014 | $6,292 | $78,400 | $26,000 | $52,400 |
Source: Public Records
Map
Nearby Homes
- 401 N Lincoln Ave
- 333 1st St
- 9 Emma Place
- 143 Parker St
- 14 New St
- 130 2nd St
- 124 Cindy Ct
- 121 1st St
- 126 3rd St
- 122 3rd St
- 123 3rd St
- 126 Stephenson Ave
- 110 Mountain Pkwy
- 837 Voorhees Ave
- 109 Warrenville Rd
- 5 Foxhall Unit A
- 5A Foxhall Unit 5
- 47B Gramercy Gardens Unit B
- 47 Gramercy Gardens Unit B
- 38 Warrenville Rd