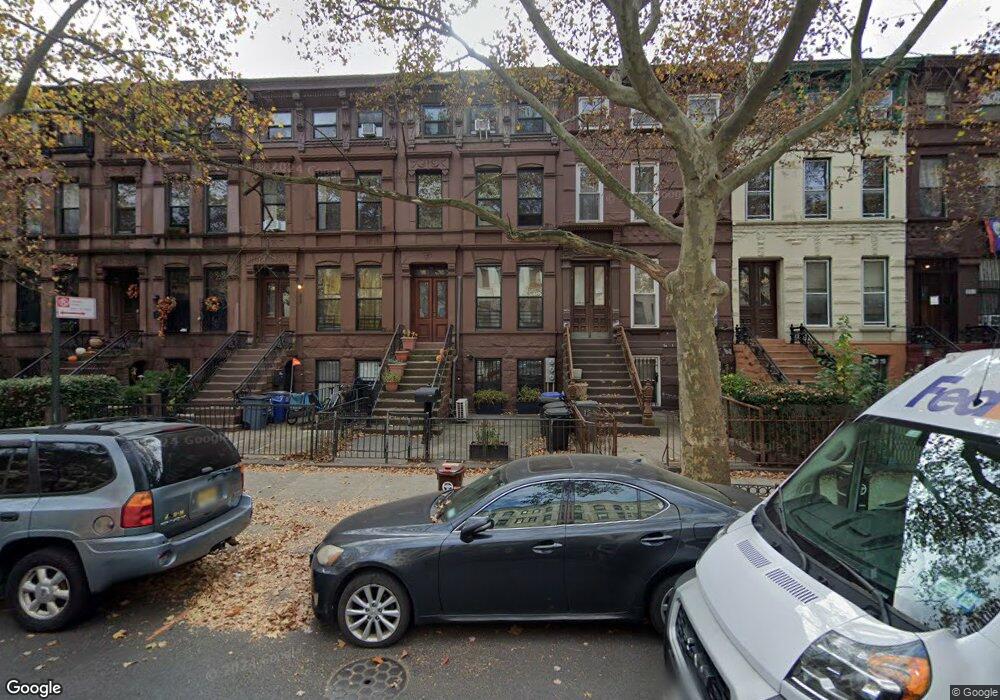
296 Halsey St Brooklyn, NY 11216
Bed-Stuy NeighborhoodEstimated Value: $2,182,000 - $2,375,000
Studio
--
Bath
2,880
Sq Ft
$792/Sq Ft
Est. Value
About This Home
This home is located at 296 Halsey St, Brooklyn, NY 11216 and is currently estimated at $2,282,333, approximately $792 per square foot. 296 Halsey St is a home located in Kings County with nearby schools including P.S. 44 Marcus Garvey, Leadership Preparatory Bedford Stuyvesant Charter School, and Mount Pleasant Christian Academy.
Ownership History
Date
Name
Owned For
Owner Type
Purchase Details
Closed on
Feb 6, 2012
Sold by
Rosario Angel
Bought by
Blanchon-Ehrsam Agathe and Ehrsam Pascal
Current Estimated Value
Home Financials for this Owner
Home Financials are based on the most recent Mortgage that was taken out on this home.
Original Mortgage
$645,300
Interest Rate
3.44%
Mortgage Type
Purchase Money Mortgage
Purchase Details
Closed on
Jun 15, 2010
Sold by
Gill Wendell O
Bought by
Rosario Angel
Purchase Details
Closed on
Apr 10, 2008
Sold by
Martin June and Martin Nicole
Bought by
Oliver Gill Wendell
Create a Home Valuation Report for This Property
The Home Valuation Report is an in-depth analysis detailing your home's value as well as a comparison with similar homes in the area
Home Values in the Area
Average Home Value in this Area
Purchase History
| Date | Buyer | Sale Price | Title Company |
|---|---|---|---|
| Blanchon-Ehrsam Agathe | $980,000 | -- | |
| Blanchon-Ehrsam Agathe | $980,000 | -- | |
| Blanchon-Ehrsam Agathe | $980,000 | -- | |
| Blanchon-Ehrsam Agathe | $980,000 | -- | |
| Rosario Angel | $700,000 | -- | |
| Rosario Angel | $700,000 | -- | |
| Rosario Angel | $700,000 | -- | |
| Rosario Angel | $700,000 | -- | |
| Oliver Gill Wendell | $630,000 | -- | |
| Oliver Gill Wendell | $630,000 | -- | |
| Oliver Gill Wendell | $630,000 | -- | |
| Oliver Gill Wendell | $630,000 | -- |
Source: Public Records
Mortgage History
| Date | Status | Borrower | Loan Amount |
|---|---|---|---|
| Previous Owner | Blanchon-Ehrsam Agathe | $645,300 |
Source: Public Records
Tax History
| Year | Tax Paid | Tax Assessment Tax Assessment Total Assessment is a certain percentage of the fair market value that is determined by local assessors to be the total taxable value of land and additions on the property. | Land | Improvement |
|---|---|---|---|---|
| 2025 | $1,799 | $92,160 | $13,020 | $79,140 |
| 2024 | $1,799 | $108,420 | $13,020 | $95,400 |
| 2023 | $1,819 | $133,020 | $13,020 | $120,000 |
| 2022 | $1,774 | $111,360 | $13,020 | $98,340 |
| 2021 | $1,764 | $85,980 | $13,020 | $72,960 |
| 2020 | $828 | $94,260 | $13,020 | $81,240 |
| 2019 | $1,561 | $93,960 | $13,020 | $80,940 |
| 2018 | $1,522 | $7,464 | $839 | $6,625 |
| 2017 | $1,509 | $7,405 | $1,313 | $6,092 |
| 2016 | $1,397 | $6,986 | $1,555 | $5,431 |
| 2015 | $843 | $6,592 | $1,652 | $4,940 |
| 2014 | $843 | $6,220 | $1,870 | $4,350 |
Source: Public Records
Map
Nearby Homes
- 292 Halsey St
- 210 Macon St
- 251 Macon St
- 259 Halsey St Unit 1R
- 569 Throop Ave
- 341 Hancock St
- 289 Macon St
- 44-46 Decatur St
- 44 Decatur St
- 436 Putnam Ave
- 106 Decatur St
- 359 Herkimer St
- 323 Jefferson Ave
- 263 Hancock St
- 470 Jefferson Ave
- 135 Decatur St
- 482 Jefferson Ave Unit TWNHSE
- 482 Jefferson Ave
- 237 Hancock St Unit 11
- 237-239 Hancock St Unit 11
- 296 Halsey St Unit 3
- 296 Halsey St Unit 2
- 296 Halsey St Unit 1
- 298 Halsey St
- 294 Halsey St
- 300 Halsey St
- 302 Halsey St
- 290 Halsey St
- 290 Halsey St Unit 1
- 304 Halsey St
- 288 Halsey St
- 286 Halsey St
- 308 Halsey St
- 284 Halsey St
- 235 Macon St
- 233 Macon St
- 310 Halsey St
- 239 Macon St
- 237 Macon St
- 237 Macon St Unit 1
Your Personal Tour Guide
Ask me questions while you tour the home.