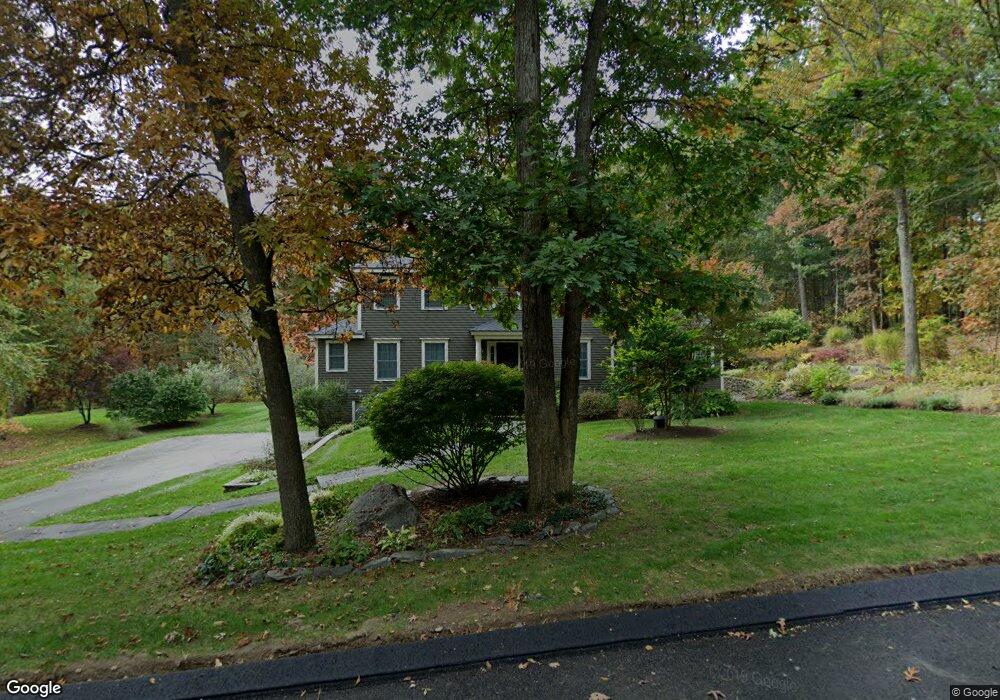
296 Joseph Rd Boxborough, MA 01719
Estimated Value: $858,000 - $1,136,000
3
Beds
3
Baths
2,576
Sq Ft
$377/Sq Ft
Est. Value
About This Home
This home is located at 296 Joseph Rd, Boxborough, MA 01719 and is currently estimated at $970,633, approximately $376 per square foot. 296 Joseph Rd is a home located in Middlesex County with nearby schools including Acton-Boxborough Regional High School.
Ownership History
Date
Name
Owned For
Owner Type
Purchase Details
Closed on
Jun 22, 2015
Sold by
Shade Lawrence H and Shade Jennifer K
Bought by
Shade Jennifer K
Current Estimated Value
Home Financials for this Owner
Home Financials are based on the most recent Mortgage that was taken out on this home.
Original Mortgage
$178,000
Interest Rate
3.78%
Mortgage Type
New Conventional
Purchase Details
Closed on
Apr 19, 1999
Sold by
Johnson David C and Johnson Ann L
Bought by
Shade Lawrence H and Shade Jennifer A
Purchase Details
Closed on
Oct 29, 1993
Sold by
Northwest Structures
Bought by
Johnson David C and Johnson Ann L
Create a Home Valuation Report for This Property
The Home Valuation Report is an in-depth analysis detailing your home's value as well as a comparison with similar homes in the area
Home Values in the Area
Average Home Value in this Area
Purchase History
| Date | Buyer | Sale Price | Title Company |
|---|---|---|---|
| Shade Jennifer K | -- | -- | |
| Shade Jennifer K | -- | -- | |
| Shade Jennifer K | -- | -- | |
| Shade Lawrence H | $391,000 | -- | |
| Johnson David C | $299,250 | -- |
Source: Public Records
Mortgage History
| Date | Status | Borrower | Loan Amount |
|---|---|---|---|
| Closed | Shade Jennifer K | $178,000 | |
| Closed | Shade Jennifer K | $150,000 |
Source: Public Records
Tax History Compared to Growth
Tax History
| Year | Tax Paid | Tax Assessment Tax Assessment Total Assessment is a certain percentage of the fair market value that is determined by local assessors to be the total taxable value of land and additions on the property. | Land | Improvement |
|---|---|---|---|---|
| 2025 | $13,865 | $915,800 | $293,700 | $622,100 |
| 2024 | $12,839 | $856,500 | $282,300 | $574,200 |
| 2023 | $12,279 | $791,200 | $254,300 | $536,900 |
| 2022 | $11,769 | $675,600 | $254,300 | $421,300 |
| 2020 | $10,646 | $636,700 | $254,300 | $382,400 |
| 2019 | $10,455 | $636,700 | $254,300 | $382,400 |
| 2018 | $10,226 | $622,000 | $242,300 | $379,700 |
| 2017 | $10,259 | $610,300 | $244,500 | $365,800 |
| 2016 | $9,755 | $596,300 | $244,500 | $351,800 |
| 2015 | $9,838 | $590,900 | $244,100 | $346,800 |
| 2014 | $9,940 | $561,900 | $241,600 | $320,300 |
Source: Public Records
Map
Nearby Homes
- 139 Picnic St
- 605 Stow Rd
- 14 Leonard Rd
- 5 Elm St Unit 1
- 285 Central St Unit 285
- 58 Spencer Rd Unit 18K
- 50 Spencer Rd Unit 36
- 4 Huron Rd
- 53 Swanson Ct Unit 36C
- Lot 2 Strawberry Farm
- 92 Willow St Unit 3
- 92 Willow St Unit 2
- 90 Willow St Unit 1
- 220 Swanson Rd Unit 605
- 220 Swanson Rd Unit 606
- 220 Swanson Rd Unit 604
- 4,7,8 Crestwood Ln
- 310 Codman Hill Rd Unit 35D
- 4 Omega Way
- 305 Harwood Ave